Force Motors Ltd (formerly Bajaj Tempo Ltd), the flagship company of the Abhay Firodia Group, is a leading manufacturer of light commercial vehicles (LCVs) like the Traveller, Urbania, and Trax, along with utility vehicles like the Gurkha. Apart from its own vehicles, the company also supplies engines and axles for the Indian operations of BMW and Mercedes-Benz. It also has a joint venture with Rolls-Royce Power Systems AG to manufacture engines for power generation and rail applications.
In recent years, Force Motors Ltd has reported a sharp increase in its sales and profits, attracting strong interest from investors. However, our experience shows that during periods of improving business performance, investors may, at times, overlook and underestimate risks such as industry cyclicality, labour unrest, dependence on outside technology, related-party transactions, and capital allocation decisions that are very important from a long-term perspective.
Please note that this analysis is not aimed at giving a buy or sell decision. Instead, it aims to highlight key aspects that investors usually ignore during phases of strong business growth so that long-term investors can analyse them carefully before forming an opinion about the company.
Important Business and Governance Risks at Force Motors Ltd
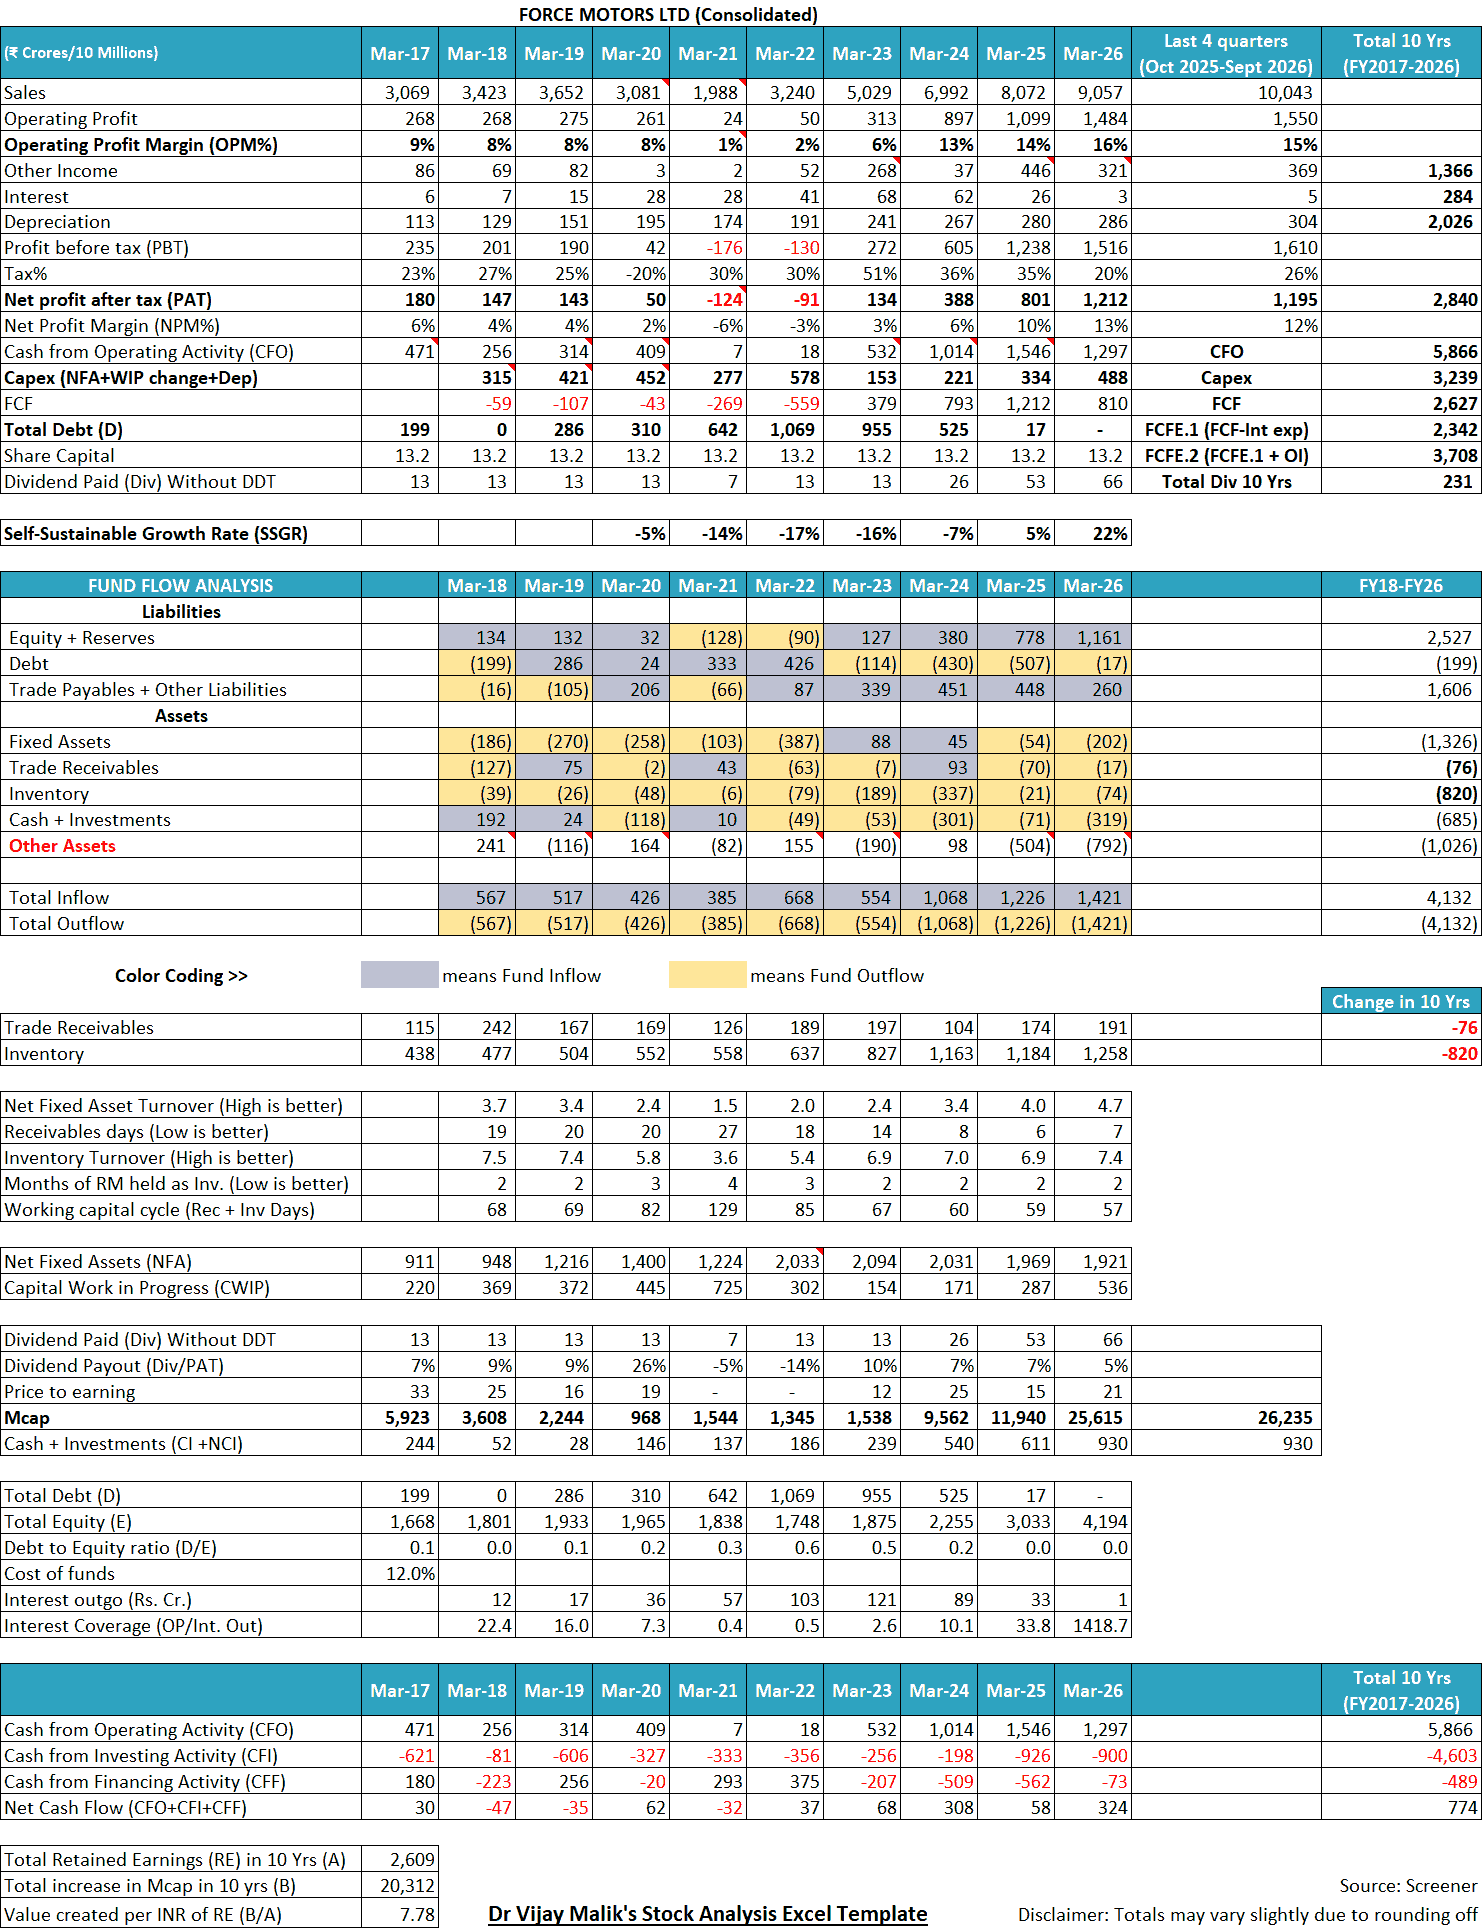
A snapshot of the financial performance of Force Motors Ltd over the last 10 years is provided below to give you the context for the discussion that follows:
1) Cyclicality in Both Own Vehicle and Auto-Component Businesses of Force Motors Ltd:
In recent years, Force Motors Ltd has reported a sharp recovery in its business performance, led by strong demand for its commercial vans like the Traveller and Urbania, utility vehicles like the Trax, and bulk orders from govt. for ambulances and defence vehicles.
The company’s operating revenue increased from ₹1,988 cr in FY2021 to ₹10,043 cr in the last 12 months ending Sept 2026 (i.e. Oct 2025-Sept 2026). During the same period, its operating profit increased from ₹24 cr to ₹1,550 cr in FY2026.
When any company reports such strong growth over recent years, investors may start to believe that this might be a permanent phase of high growth.
However, a study of the Annual Reports (AR) of Force Motors Ltd over the last three decades shows that the company operates in a highly cyclical industry where periods of strong profits have frequently been followed by sharp downturns and losses.
1.1) History of sharp profit declines, operating losses, and accounting adjustments:
The performance of the commercial vehicle (CV) industry is highly cyclical as it is closely linked to general economic activity, interest rates, farm income, and government spending. Over the last 30 years (FY1996-FY2026), whenever the economic cycle had a downturn, Force Motors Ltd suffered steep declines in its earnings.
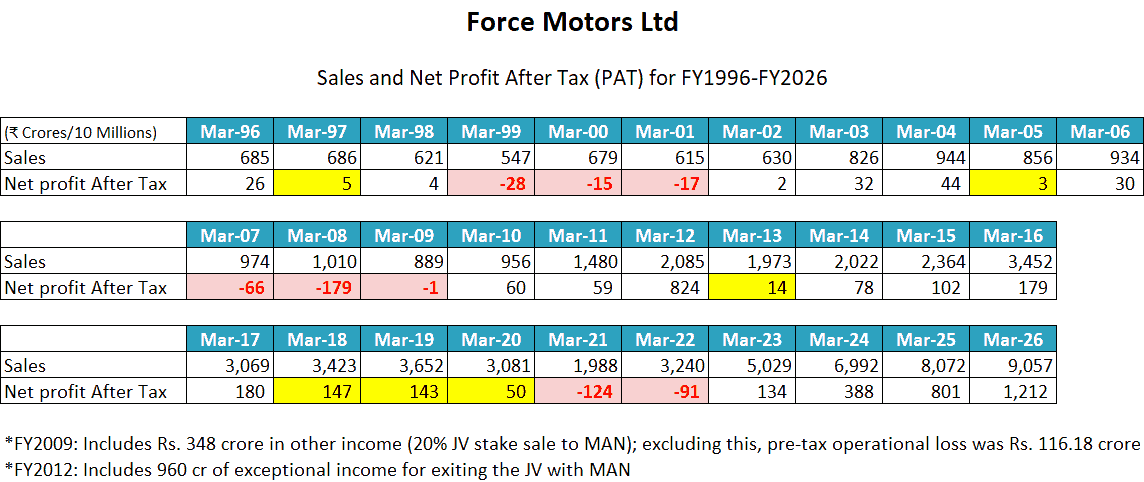
For example, the company witnessed declines in net profit in FY1997 (when net profit fell 80% from ₹26 cr to ₹5 cr), FY1998, FY2005 (when profit dropped from ₹44 cr to ₹3 cr), FY2013, FY2018, FY2019, and FY2020.
At times of severe industry downturns, Force Motors Ltd even reported losses for multiple years at a stretch:
- First loss-making phase (FY1999 to FY2001): Poor demand for commercial vehicles resulted in accumulation of huge unsold inventory of vehicles. As a result, the company had to stop production at both its Akurdi (Pune) and Pithampur plants for several weeks in May and June 1998 (AR1999, P5). As a result, Force Motors Ltd reported net losses of ₹28 cr in FY1999, ₹15 cr in FY2000, and ₹17 cr in FY2001 (AR1999, P11; AR2000, P15; AR2001, P13).
- Second loss-making phase (FY2006 to FY2009): During these four years, Force Motors Ltd suffered heavy operating losses, even though it reported positive net profits in FY2006 and FY2009.
- In FY2006, the company actually incurred a loss before tax of ₹50 cr. However, it retrospectively changed its accounting method for calculating depreciation on fixed assets from the written-down value (WDV) method to the straight-line method (SLM). This accounting change added back ₹79.77 cr of past years’ depreciation into the profit and loss statement and reduced the current year’s depreciation expense by ₹3.56 cr, inflating the reported profit before tax by ₹83.33 cr (AR2006, P10, P61).
AR2006, P61:
The Group has changed the method of providing depreciation on fixed assets from ‘written down value method’ to ‘straight line method’… Consequently, the profit before tax and tax expense for the current year are higher by Rs. 83,32,84,789/- and Rs. 31,95,06,577/- respectively
- In FY2007, Force Motors Ltd reported a net loss of ₹65 cr, which would have been even higher if it did not have a ₹26.8 cr profit from the sale of investments (AR2007, P9, P55).
- In FY2008, the net loss increased sharply to ₹178 cr (AR2008, P7).
- In FY2009, the company again suffered a heavy operating loss before tax of ₹116.18 cr. However, it reported a net profit after tax of ₹124 cr because it had capital gains of ₹306.30 cr from selling a 20% stake in its truck joint venture (MAN Force Trucks Pvt. Ltd.) (AR2009, P5, P9, P52).
- Third loss-making phase (FY2021 and FY2022): Due to the automobile industry slowdown that began in FY2019 and the subsequent Covid-19 pandemic, demand for the company’s vehicles declined, which pushed Force Motors Ltd back into losses in FY2021 and FY2022 (AR2021, P18; AR2022, P26).
This long history shows why relying only on the recent profit data can be misleading. Whenever a company operates in a cyclical industry, projecting recent upcycle earnings into the future can lead to a very high risk. Moreover, as seen in FY2006 and FY2009, investors should always check whether the reported profits have come from actual vehicle sales (i.e. operating earnings) or from accounting changes and asset sales (non-operating, one-time profits) to understand the true health of the business.
Advised reading: How to do Business Analysis of a Company
1.2) Vulnerability to raw material prices and lump-sum government incentives:
Manufacturing commercial vehicles, and engines etc. requires large quantities of steel, aluminium, and other metals whose prices are highly fluctuating as per stage of commodity cycles. Due to intense competition, Force Motors Ltd is not able to pass on sudden increases in input costs to its buyers.
In the past, sharp increases in steel and raw material prices affected the company’s profitability in FY2005, FY2007, FY2008, and FY2009 (AR2005, P23; AR2007, P12; AR2008, P10; AR2009, P9).
Even during the current upcycle, raw material price fluctuations have impacted its profit margins. For example, in Q1-FY2027, rising material costs caused a drop in the company’s operating profit margin.
Credit Rating report (CR), CR2026 by CRISIL, P1:
Operating margin moderated to 13.4% in the first quarter of fiscal 2027 from 14.5% in the corresponding period of fiscal 2026, owing to increase in material cost following the West Asia crisis.
In addition, an investor should pay close attention to large, lump-sum state government subsidies shown by the company in “Exceptional Items”. Under the Madhya Pradesh Industrial Investment Promotion Assistance Scheme, 2010, Force Motors Ltd gets incentives for its Pithampur plant.
Between FY2014 and FY2017, the company recognised ₹20.73 cr to ₹31.50 cr per year as industrial promotion incentives as “Other Income” (AR2014, P76; AR2015, P89; AR2016, P82; AR2017, P108). However, after the implementation of the Goods and Services Tax (GST), due to the absence of clear guidelines, Force Motors Ltd had to reverse ₹39 cr of previously booked incentives as an exceptional expense in FY2020 (AR2020, P14, P122).
Later, when the Madhya Pradesh government started releasing subsidies for multiple past years at once, Force Motors Ltd recorded large lump-sum amounts in its profit and loss statement as exceptional income:
- FY2023: ₹308.31 cr as exceptional income for four past financial years (FY2018 to FY2021), along with ₹44.15 cr under other income for FY2022 (AR2023, P127, P129).
- FY2025: ₹394.57 cr as exceptional income for the past two financial years (₹140.21 cr for FY2023 and ₹254.36 cr for FY2024) (AR2025, P185).
- FY2026: ₹288.63 cr as exceptional income for FY2025 (AR2026, P209).
When multi-year government subsidies relating to earlier periods are recognised in a single year, they may show net profit much larger than what the operating business actually makes. Therefore, separating these lump-sum exceptional items from core operating profits would help an investor avoid overestimating the sustainable earnings of Force Motors Ltd.
Advised reading: How to do Financial Analysis of a Company
1.3) Customer concentration and cyclicality in the luxury auto-component and Rolls-Royce JV businesses:
Apart from selling its own vehicles, Force Motors Ltd derives around 40% to 50% of its revenue from manufacturing engines, axles etc. for luxury carmakers, e.g. BMW, Mercedes etc. (AR2018, P11; CR2022 by CRISIL, P1).
Since 2015, the company has operated a dedicated plant in Chennai to supply engines for BMW India, and since 2016, it has operated a dedicated plant in Chakan, Pune, to supply engines and axles for Mercedes-Benz India (AR2015, P15, P30; AR2016, P14).
This business has a very high customer concentration risk because it depends entirely on just two clients, BMW and Mercedes-Benz. Moreover, luxury car sales are also exposed to economic slowdowns. For example, during the slowdown in FY2020, this segment for Force Motors Ltd witnessed more than a 30% decline in sales (AR2020, P14).
To diversify its revenue stream beyond road vehicles, Force Motors Ltd entered into a 51:49 joint venture (JV) with Rolls-Royce Power Systems AG (through its subsidiary MTU Friedrichshafen GmbH) and incorporated Force MTU Power Systems Pvt. Ltd. (FMTU) in August 2018 (AR2018, P13; AR2019, P18). This JV created a dedicated factory at Chakan, Pune, to manufacture engines for power generation and rail applications for both domestic and export markets.
The start of the plant was delayed by over two years due to the Covid pandemic. However, even after starting production, the joint venture incurred heavy net losses of ₹36.47 cr on revenue of ₹231.61 cr in FY2023, and ₹27.12 cr on revenue of ₹262.29 cr in FY2024 (AR2024, P45).
In FY2025 and FY2026, despite generating revenues of ₹273.57 cr and ₹260.32 cr respectively, the joint venture barely made money, reporting minuscule profits of ₹1.01 cr in FY2025 and just ₹0.22 cr in FY2026 (AR2026, P64).
Thus, nearly eight years after forming the joint venture with Rolls-Royce Power Systems AG, Force Motors Ltd is earning a net profit margin of less than 0.1% (₹0.22 cr profit on ₹260.32 cr sales) from this business.
Therefore, investors should examine the actual profitability of subsidiaries and joint ventures, rather than getting carried away by big global brand names like Rolls-Royce. This would help an investor determine whether diversification is genuinely adding value for shareholders.
2) Prolonged Labour Unrest and Politically Backed Union Rivalries at Force Motors Ltd:
Force Motors Ltd’s business is very labour-intensive. When an investor studies the history of the company, she notices that it has frequently faced severe labour strikes and politically backed inter-union rivalries. On multiple occasions, these labour issues stopped production in its plants and even shut down its administrative offices for weeks.
The major episodes of industrial strikes at Force Motors Ltd include:
- Complete stoppage of production at the Pithampur plant (FY1997 and FY1998): In FY1997, labour issues at the Pithampur (Madhya Pradesh) plant led to a 70% drop in net profit (AR1997, P8, P9). In the next year, the labour trouble worsened, leading to a complete shutdown for 48 days from June 2, 1997 to July 19, 1997, which severely impacted the company’s sales and profits (AR1998, P7).
- 33-day strike shutting down both the Akurdi plant and administrative offices (FY2000 and FY2001): In FY2000, a labour strike in the administration office for 33 days (AR2000, P9) led to delays in preparing its annual financial accounts. In FY2001, a labour strike shut down production at its Akurdi, Pune, plant in May and June 2000 for 33 days (AR2001, P6). This strike caused a sharp decline in sales and deep losses for the company (AR2001, P6, P13).
- The 14-year politically backed inter-union battle at Akurdi (FY2002 to FY2016): Beginning around 2002, at the Akurdi plant, Force Motors Ltd faced a 14-year-long war between two rival labour unions backed by opposing political parties: Bharatiya Kamgar Sena (BKS), backed by Shiv Sena, and Poona Employees Union (PEU), backed by leftist trade union groups for the status of “Sole Bargaining Agent”. This dispute led to long legal battles across the Industrial Court, the Bombay High Court, and finally the Supreme Court of India (AR2006, P10; AR2009, P5; AR2016, P14).
- During this dispute, Force Motors Ltd faced a five-month-long go-slow agitation in FY2005, causing a sharp drop in the company’s sales and profits as net profits declined from ₹44 cr in FY2004 to ₹2.7 cr in FY2005 (AR2004, P17; AR2005, P20, P23).
- As the Akurdi plant supplied engines and components to the Pithampur plant, the labour dispute at Akurdi disrupted both plants and led to heavy losses for the company during FY2006 to FY2008 (AR2007, P9; AR2008, P7).
- The 14-year struggle finally ended in December 2015 when the Supreme Court of India upheld the recognition of the BKS (AR2016, P14).
AR2016, P14:
The long festering Industrial Relations issue at Akurdi, on account of the inter-union rivalry, was settled by the Supreme Court’s Judgment in favour of the erstwhile recognised union. Subsequent to this, the Company has been able to sign a fresh wage agreement with the recognised union
In labour disputes, many times, things become out of management’s control, and the company’s business suffers heavily even when demand for its products is good. Therefore, checking a company’s history of labour relations helps an investor become aware of the risks that can reappear in future.
Also read: How to study Annual Report of a Company
3) Heavy Dependence of Force Motors Ltd on Outside Technology and Failed Ventures:
An analysis of the history of Force Motors Ltd shows that since its inception, it has rarely developed any successful vehicle platform completely on its own. At almost every step, Force Motors Ltd has relied on purchasing designs, licences, and technical assistance from overseas companies.
On multiple occasions, this dependence on outside technology failed to work for the company, leading to failed joint ventures, abandoned projects, legal disputes, and large write-offs of shareholders’ money.
3.1) Reliance on foreign partners for technology and exit from the in-house tractor business:
Right from the start, Force Motors Ltd focused on importing foreign vehicle designs and localising them in India:
- In 1948, it brought the 3-wheeler Tempo vehicle from Germany and later indigenised it under Bajaj Tempo Ltd (AR2025, P5).
- Similarly, it brought the Tempo Traveller into India in 1987 through a collaboration with Daimler-Benz (Mercedes-Benz), and indigenised it over the years by purchasing dies from DaimlerChrysler AG (AR1999, P5; AR2005, P5).
Over the last three decades (FY1996-FY2026), whenever Force Motors Ltd needed to upgrade its engines, gearboxes, axles, or vehicle bodies, it repeatedly resorted to foreign technology suppliers and consultants:
- DaimlerChrysler AG (Germany): Sourced technology for Common Rail Direct Injection (CRDI) diesel engines in FY2004 and G32 gearboxes in FY2005 (AR2004, P13; AR2005, P10, P20).
- MAN Group (Germany): Signed agreements for medium and heavy commercial vehicle diesel engines and cabs in FY2004, and heavy-duty planetary rear axles in FY2005 (AR2004, P13; AR2005, P20, P21).
- ZF Friedrichshafen AG (Germany): Purchased technology for heavy-duty truck and bus gearboxes in FY2005 (AR2005, P11, P20).
- MBtech (Germany) and Lotus Engineering (UK): Hired MBtech for electronic architecture and coachwork quality, and Lotus Engineering for ride handling and driving comfort in FY2011 (AR2011, P7).
- Daimler AG and GETRAG (Germany): Entered into licensing and technical agreements for a Multi-Purpose Vehicle (MPV) and its transaxles in FY2012 (AR2012, P7).
- Magna Steyr, AVL (Austria), Bosch, Delphi, and Ricardo: Sourced ongoing technical support for upgrading transmissions, axles, and engines to meet Euro IV / BS IV and subsequent emission norms (AR1997, P9; AR2013, P9; AR2014, P17, P20; AR2016, P15).
One segment that Force Motors Ltd claimed to have designed and developed completely in-house from day one was agricultural tractors. In FY1997 and FY1998, the company launched its indigenously designed OX-45 and OX-35 tractors and later expanded to multiple brands like the Balwan, OX-25, Sanman, and Abhiman series. It also set up a dedicated assembly plant at Akurdi (AR1997, P8; AR1998, P8; AR2002, P11, P12; AR2019, P16).
However, despite investing time and money into the tractor division for 27 years, Force Motors Ltd could never scale up the business or win a meaningful market share against other players like Mahindra & Mahindra and TAFE (CR2016 by CRISIL, P2). Ultimately, in FY2024, Force Motors Ltd acknowledged that its tractor business is not performing satisfactorily and permanently shut it down (CR2024 by CRISIL, P2).
AR2024, P44:
Due to stagnation of the Company’s Tractor business, it was decided to exit that activity in a planned and smooth manner.
3.2) Failure of the heavy commercial vehicle joint venture with MAN:
In 2002, Force Motors Ltd decided to enter the Heavy Commercial Vehicle (HCV) segment and planned an investment of about ₹550 cr at Pithampur (AR2005, P10, P13). After buying truck engine, cab, axle, and gearbox technologies from MAN and ZF, Force Motors Ltd formed a 70:30 joint venture (JV) with MAN Nutzfahrzeuge AG in April 2006 named MAN Force Trucks Pvt. Ltd (MFTPL). (AR2006, P13; AR2011, P8).
However, this venture soon ran into trouble as the foreign technology was not adapted to Indian market conditions:
- Uncompetitive pricing due to over-engineering: MFTPL decided to sell trucks in India with international power levels and expensive cabin features, resulting in high prices, which made the trucks uncompetitive (AR2009, P8).
- Failure of export promises: One of the major reasons why Force Motors Ltd gave an equity stake to MAN in the JV was MAN’s offer to export up to 10,000 trucks per year using its global network (AR2011, P8). However, due to the global economic slowdown in 2008, export orders did not materialise, and the JV was left with heavy investments and high inventory, leading to large losses (AR2009, P8, P9).
AR2009, P8:
…after the formation of the joint venture, a decision was taken to offer in India vehicles with internationally compatible levels of power density, resulting in increase in the cost of the product. The fitments and facilities provided in the CLA truck range also far exceeded the normal Indian standards. These aspects increased cost of the product. The overall cost increase made the product uncompetitive in the Indian market.
Because of large losses in the truck business, Force Motors Ltd first reduced its stake in the joint venture from 70% to about 50% in FY2009 by selling shares to MAN for ₹309.47 cr (AR2009, P5, P9). When the business still struggled to improve, Force Motors Ltd exited the joint venture completely in March 2012 by selling its remaining stake to MAN for €150 million (₹1,016.51 cr) (AR2011, P8; AR2012, P6).
3.3) Abandonment and write-off of the Multi-Purpose Vehicle (MPV) and Utility Van projects:
In FY2012, Force Motors Ltd signed a licensing agreement with Daimler AG to obtain drawings, designs, and tooling for a luxury Multi-Purpose Vehicle (MPV), along with a technical agreement with GETRAG for transaxles (AR2011, P7; AR2012, P7). To manufacture this MPV, the company acquired land and constructed new factory buildings at Pithampur (AR2012, P9; AR2013, P7).
However, within just two years, the entry of new competitors and changing customer price expectations made the MPV project unviable. By FY2014, Force Motors Ltd put the MPV project “under review” and hired strategy consultants Roland Berger to re-examine its product portfolio (AR2014, P20). By FY2015, the company exited the personal car segment, highlighting that it produces only “working vehicles” and not personal-use vehicles (AR2015, P30).
Force Motors Ltd faced a similar setback for another foreign-assisted project, the Utility Van Platform (T0 platform). After spending over ₹122 cr on buying dies and developing this platform using foreign technical assistance, the company abandoned this project.
As a result, the company had to write off ₹100 cr in FY2023 across intangible assets under development and capital work-in-progress (AR2023, P110, P114, P116, P129).
AR2023, P129:
One of the Projects…Utility Van Platform…the Company came to conclusion that it is not worthwhile pursuing the Project…it is decided that the intangible assets under development…and…capital work-in-progress…be written off. Accordingly the value of the capital asset…was reduced from ₹12,216 lakhs to ₹2,217 lakhs…when scrapped.
An investor should note that when a company buys ready-made designs and expensive tooling from foreign partners without building its own product development capabilities, it faces challenges in modifying the vehicle when raw material costs rise or if competitors launch better-priced models. As a result, the expensive dies and machinery bought with shareholders’ money end up being sold as scrap metal.
3.4) Delayed electric vehicle (EV) development and arbitration with a German technology partner:
The risks of relying on outside technology reappeared when Force Motors Ltd tried to build electric vehicles (EVs).
In FY2017, the company informed shareholders that it had started developing electric vehicles and that its first electric Traveller was undergoing trials (AR2017, P17). Two years later, in FY2019, the management claimed that all its vehicles would be electrified over the next two years, that is, by FY2021 (AR2019, P31).
AR2019, P31:
All the Traveller platforms i.e. T1, T2 and T3 ranges – spanning seating capacities from 9 seats to 41 seats, as also other platforms of the Company dealing with passenger and goods transport, will be electrified over the next two years.
However, it could not meet this deadline. After four years, in FY2023, its electric vehicles were still undergoing introduction trials (AR2023, P45).
By FY2025, nearly eight years after announcing its EV trials, Force Motors Ltd admitted that its commercial EV products had failed to find buyers in the market (AR2025, P56).
AR2025, P56:
While your Company has created EV options for our van segment vehicles, the commercial products has not been strongly taken up as the market is yet evolving.
For EV technology also, Force Motors Ltd looked at foreign companies. In May 2019, it signed a technology transfer agreement with a German engineering firm, Dipl.-Ingenieure Rainer & Oliver PULS GmbH (Sources: IndiaKanoon, Legalcell). However, the deal faced issues.
Force Motors Ltd alleged that the German partner failed to deliver the technology and initiated arbitration against it, while the German firm filed counterclaims against it (AR2024, P170; AR2026, P210). The dispute reached the Bombay High Court and the Supreme Court of India and remains unresolved even in FY2026 (AR2026, P210).
As per recent media coverage, Force Motors Ltd plans to invest ₹3,000 cr in EV technology (Source: Economic Times)
When an investor looks at all these incidents together: heavy trucks with MAN, personal MPVs with Daimler, the T0 utility van platform, or electric vehicles with PULS GmbH, she notices that relying on borrowed foreign technology has repeatedly failed to generate sustainable growth in new segments for Force Motors Ltd.
Therefore, whenever an investor notices any automobile company announcing its entry into new categories, then she should check whether the company has in-house research capabilities or is just buying technology from foreigners. This is because, frequently, such technological imports result in disappointments, e.g. OLA Electric.
Advised reading: How to analyse New Companies in Unknown Industries?
4) Corporate Governance, Promoter Remuneration, and Related-Party Transactions at Force Motors Ltd:
4.1) Steep increase in promoter remuneration despite public institutional dissent:
We believe that the remuneration levels of promoters and how it changes during different phases of company’s performance are a good parameter that every long-term investor should analyse. This is because it provides important insights into whether promoters prioritise their own interests over public shareholders.
In the case of Force Motors Ltd, during FY2017-FY2019, net profit after tax (PAT) of the company declined from ₹180 cr in FY2017 to ₹143 cr in FY2019. However, during this period, the remuneration of the promoter, Mr Prasan Firodia, Managing Director, increased from ₹1.36 cr (AR2017, P25) to ₹5 cr (AR2019, P25).
During the recent industry upturn, Mr Prasan Firodia’s remuneration has multiplied manifold, rising to ₹43 cr in FY2026 (AR2026, P78).
Taking ₹43 cr in a single year led to strong opposition from institutional investors. In the Annual General Meeting (AGM) of Force Motors Ltd held on September 18, 2026, nearly 34% of public institutional shareholders voted against the resolution for the reappointment of Mr Prasan Firodia as Managing Director. However, because the promoters hold a majority stake in the company, their own votes ensured that the resolution passed comfortably with a 96.3% overall majority.
AGM Voting Results, Sept 18, 2026, P6:
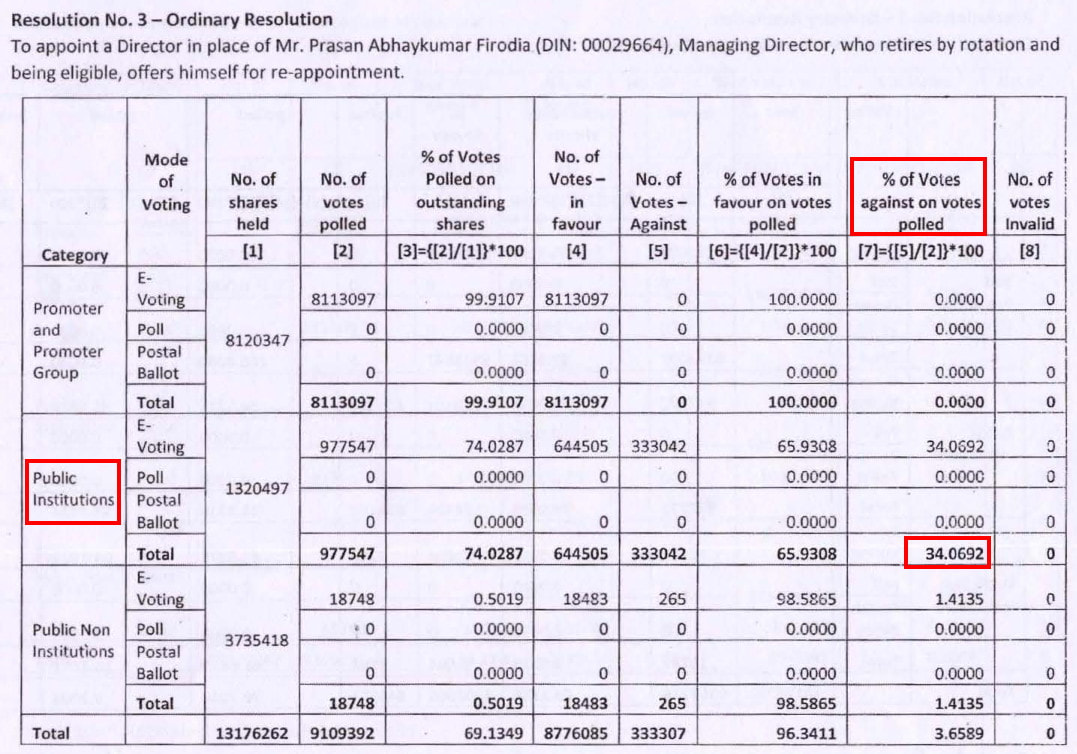
Investors should form their own opinion about increasing promoter compensation when profits are falling, and then taking ₹43 cr in a single year when profits are boosted by an industry upcycle and lump-sum government subsidy sanctions. It might be the reason why a significant share of institutional shareholders objected to the reappointment.
Also read: How to identify Promoters extracting Money via High Salaries
4.2) Large related-party transactions with promoter group entities and regulatory penalties:
Every year, Force Motors Ltd purchases hundreds of crores worth of raw materials and automotive components from promoter-group entities, esp. Jaya Hind Industries Pvt. Ltd. and Pinnacle Industries Ltd.
In FY2026, Force Motors Ltd purchased ₹645 cr of raw materials and capital goods from promoter group entities (primarily ₹246 cr from Jaya Hind Industries Pvt. Ltd. and ₹397 cr from Pinnacle Industries Ltd.), while also selling ₹64 cr of goods to Pinnacle Industries Ltd. (AR2026, P213).
Moreover, in the past, Force Motors Ltd. and its management were penalised by regulators for violations related to contracts with related parties. In FY2017, the National Company Law Tribunal (NCLT) imposed compounding penalties of ₹1,50,000 on the company, ₹1,00,000 on the directors, and ₹50,000 on the officers in default (AR2017, P26).
Investors should be cautious while analysing related party transactions between the company and its promoter-group entities because these transactions provide opportunities to shift economic benefits from public shareholders to promoters when these are not in line with market prices. If the listed company pays a slightly higher price for raw materials bought from related parties, or sells goods to them at a slightly lower price, it can shift economic benefits from the public shareholders to the promoters.
Advised reading: How Promoters benefit from Related Party Transactions
4.3) Donations to promoter family trusts and political parties:
Another area where promoters and public shareholders have come face to face is the use of company property and cash for charitable trusts and political donations.
In FY2015, Force Motors Ltd gave 19,000 sq. mtrs. of its land on a 25-year lease to a trust named after the founder of the promoter family, the Navalmal Firodia Memorial Hospital Trust (AR2015, P86).
Over the years, the company has also given regular donations, such as ₹1 cr in FY2013 (AR2014, P71). Moreover, public disclosures on Electoral Bonds show that Force Motors Ltd donated ₹6.35 cr to a political party between FY2020 and FY2024 (Sources: Myneta.info, findmygov.in).
In the latest AGM on September 18, 2026, 85.9% of public institutional shareholders voted against the resolution seeking approval for charity donations. However, again, because of the promoters’ majority shareholding, the resolution was passed with a 90.7% overall majority despite overwhelming institutional rejection.
AGM Voting Results, Sept 18, 2026, P7:
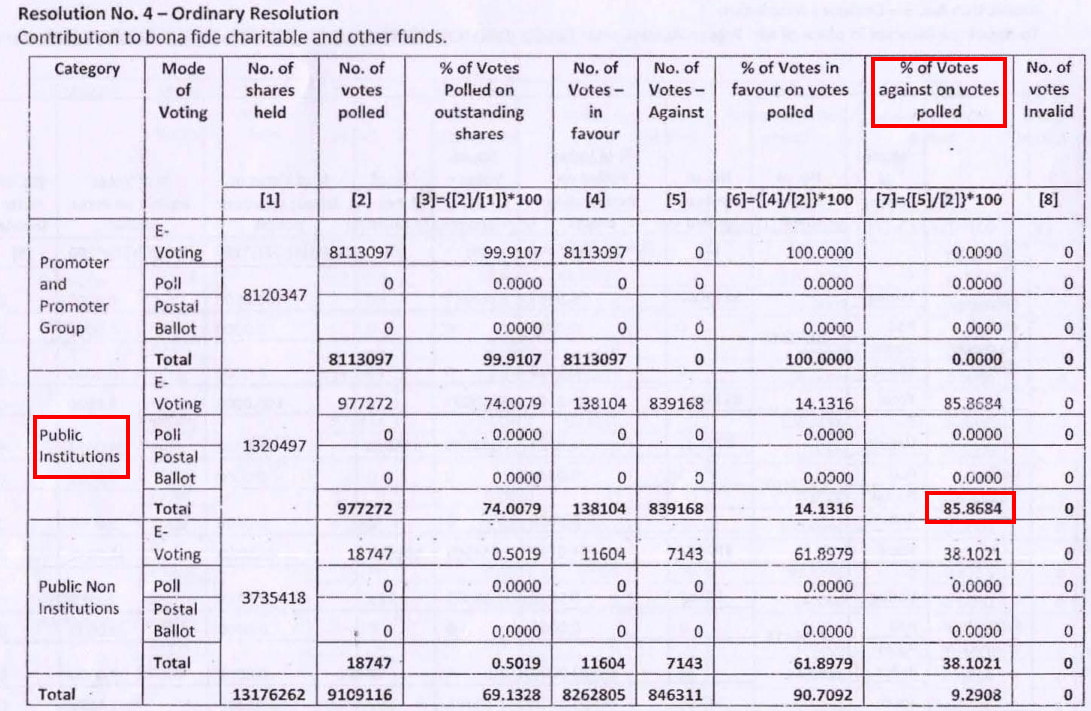
When an investor notices that a company is pushing through charity resolutions when 85.9% of institutional investors vote against them, it clearly shows that minority shareholders have very little say in how the management uses the company’s money.
Therefore, an investor should always check AGM voting results specifically for the “Public-Institutions” category as it can lead her to corporate governance red flags that are otherwise hidden behind 90%+ overall approval votes.
5) Capital Allocation Decisions of Force Motors Ltd During Periods of Surplus Liquidity:
An investor should always look for management’s capital allocation decisions when the company receives a large inflow of cash, either from a one-time asset sale or during a strong industry upcycle. A shareholder-friendly management uses surplus cash to strengthen its core business or return the excess cash to shareholders through dividends and buybacks.
In the case of Force Motors Ltd, however, history shows that whenever the company got a large amount of cash, it tends to spend significant amounts on luxury corporate aircraft, unrelated business ventures, and non-core financial investments.
5.1) Spending hundreds of crores on a corporate aircraft fleet:
For more than three decades, Force Motors Ltd has maintained a dedicated fleet of corporate aeroplanes on its balance sheet, starting with a Beechcraft King Air 65-C90A twin-turboprop (registered as VT-NKF) acquired in FY1996 (Source).
In FY2012, Force Motors Ltd received a large cash windfall of ₹1,016.51 cr (€150 million) when it sold its remaining stake in the MAN truck joint venture to its German partner (AR2012, P6, P36). In the very next year (FY2013), on top of its existing aircraft (gross block of ₹31 cr), the management spent ₹136.2 cr of company funds to buy a heavy, long-range luxury corporate jet, a Bombardier Challenger 300 (registered as VT-APF on April 11, 2013) (AR2013, P28; Source: Lok Sabha Unstarred Question No. 4369, June 17, 2016).
The company faced strong opposition from public shareholders for spending nearly ₹136 cr of shareholders’ money on a luxury business jet. The management said that it needed the jet to fly employees between its headquarters in Pune and its factory in Pithampur, even though regular commercial flights between Pune and Indore were already available at a much lower cost (Source: The Economic Times).
The company’s spending on aviation did not stop there:
- In FY2016, the company spent ₹46.7 cr to purchase a new Beechcraft King Air B200GT / 250 turboprop aircraft (registered as VT-FML on September 23, 2015) (AR2016, P77; Source: Lok Sabha reply, June 17, 2016).
- In FY2021, when the core vehicle business plunged into losses during the Covid-19 pandemic, Force Motors Ltd disposed of aircraft with a gross block of ₹135.95 cr and booked a loss of ₹22.25 cr on the disposal of property, plant, and equipment (AR2021, P92, P96).
- More recently, aviation tracking records and social media visuals show that Force Motors Ltd operates an ultra-long-range Bombardier Global 6000 luxury business jet (registered as VT-AFP), which was tracked flying international routes such as between Pune and Dubai on November 3, 2026 (Source: FlightAware, Instagram).
When a listed company spends hundreds of crores of shareholders’ money to buy and maintain luxury international jets despite commercial airline connectivity, public shareholders end up bearing the cost. Moreover, an outside shareholder has no way of knowing when the corporate aircraft is being used for genuine company use or personal use.
5.2) Entering unrelated businesses like real estate and power generation:
During the recent auto industry upcycle from FY2024 to FY2026, strong operating cash flows and the receipt of past government subsidies have generated large surplus funds for Force Motors Ltd. It has reduced its total debt from ₹955 cr in March 2023 to nil in March 2026.
However, just as the cash windfall from the MAN stake sale in FY2012 was followed by the purchase of a ₹136 cr corporate jet, the current phase of surplus liquidity has prompted Force Motors Ltd to step into businesses that have little to do with manufacturing commercial vehicles and engines.
In its AGM held on September 18, 2026, Force Motors Ltd obtained shareholder approval to enter two new sectors: real estate construction and commercial power generation (AR2026, P39; AGM Voting Results, Sept 18, 2026, P9).
Constructing and selling residential homes and commercial buildings, and running thermal, hydro, or nuclear power plants for external sale are highly capital-intensive businesses with their own regulatory and operational risks. Force Motors Ltd has no experience or management expertise in real estate development or commercial power distribution.
When a company uses the cash generated during a cyclical uptrend to enter unrelated, capital-heavy industries, investors should be cautious because it exposes them to the risk of poor returns and future write-offs.
Also read: How to Identify if Management is Misallocating Capital
Conclusion: Learning for Long-Term Investors
The analysis of Force Motors Ltd shows how a strong cyclical recovery, supported by lump-sum government subsidy grants, can hide key business and governance risks. These risks become visible only when an investor studies a company across full economic cycles.
Because the automobile industry is highly cyclical, projecting recent peak earnings into the future involves significant risk, especially when we notice that in the past, Force Motors Ltd has gone through periods of sharp profit declines and multi-year operating losses. In addition, there is a real risk of labour unrest, which any long-term investor should not ignore.
Similarly, Force Motors Ltd.’s history of relying on overseas partners for technology at every step, which failed in the MAN truck venture, the MPV project, a ₹100 cr write-off in the utility van project, and ongoing arbitration and delays in electric vehicles, highlights the risks of the lack of in-house product development capabilities.
In addition, an investor should conduct a deeper promoter/management due diligence. Related party transactions like buying over ₹640 cr of raw materials and capital goods in a single year from promoter-group entities, increasing the Managing Director’s remuneration to ₹43 cr in FY2026 (against the votes of 34% of public institutional investors), making political donations and pushing through charity resolutions despite 85.9% of public institutions voting against them need careful analysis.
An investor should always assess what management does with surplus cash during good times. The decisions of Force Motors Ltd to spend hundreds of crores on luxury corporate aircraft despite regular commercial flights, and to take shareholder approval to enter unrelated and capital-heavy businesses like real estate development and commercial power generation need careful assessment.
The aim of this article is not to recommend a buy, sell, or hold opinion on Force Motors Ltd, but to learn how to separate temporary industry tailwinds from underlying business quality.
In our premium services, this kind of analysis is used primarily as a filtering tool to eliminate businesses where long-term risks outweigh the benefits of growth. Only companies that demonstrate sustainable cash flows, prudent capital allocation, and aligned promoter incentives eventually qualify for inclusion in my long-term portfolio.
Regards,
Dr Vijay Malik
P.S.
- Subscribe to Dr Vijay Malik’s Recommended Stocks: Click here
- Bengaluru “Peaceful Investing” Workshop | 31 Jan 2027: Register Here
- To learn stock investing through videos, you may subscribe to the Peaceful Investing – Workshop Videos
- 25% savings on buying our Stock Analysis Excel Template and all ebooks together: Analysis Package: Excel Template + All eBooks (25% savings)
- To download our customized Stock Analysis Excel Template for analysing companies: Stock Analysis Excel
- Learn about our stock analysis approach in the e-book: “Peaceful Investing – A Simple Guide to Hassle-free Stock Investing”
- To learn how to do business analysis of companies: e-book: Business Analysis Guide
- To pre-register/express interest in a “Peaceful Investing” workshop in your city: Click here
Disclaimer
I, Vijay Malik, am a SEBI-registered Research Analyst (Regn. No. INH100008364). This article is for educational purposes only and does not constitute investment advice or a recommendation to buy or sell any securities. Investors should do their own research before making any investment decisions.
I, or my immediate relatives, do not have any financial interest in the companies discussed as on the date of publication of this article, nor do we hold one per cent or more of the securities of such companies at the end of the month immediately preceding it. I do not have any material conflict of interest and have not received any compensation or other benefits from the companies or any third party in relation to this article during the 12 months preceding its publication. I have not served as an officer, director, or employee of the subject companies, nor have I been engaged in market making activity for them.


