The current section of the “Analysis” series covers Websol Energy System Ltd, an Indian manufacturer of solar photovoltaic cells and modules.
The “Analysis” series is an attempt to share with all the readers, our inputs to the company analysis submitted by readers on the “Ask Your Queries” section of our website.
To benefit the maximum from this article, an investor should focus on the process of analysis instead of looking for good or bad aspects of the company. She should learn the interpretation of different types of data and transactions and pay attention to the parts of annual reports etc. used to get the information. This will help her in improving her stock analysis skills.
Websol Energy System Ltd: Detailed Fundamental Analysis
Over the years, Websol Energy System Ltd did not have any subsidiary; therefore, it has always reported only standalone financials.
We believe that while analysing any company, an investor should always look at the company as a whole and focus on financials, which represent the business picture of the entire company including its subsidiaries, joint ventures etc. Consolidated financials of a company present such a picture. Therefore, if a company reports both standalone as well as consolidated financials, then in such a case, it is advised that the investor should prefer the analysis of the consolidated financials of the company, whenever they are present.
Further advised reading: Standalone vs Consolidated Financials: A Complete Guide
In the case of Websol Energy System Ltd, as until now, the company has reported only standalone financials; therefore, we have used the standalone financials in the analysis.

Financial and Business Analysis of Websol Energy System Ltd:
In the last 10 years, sales of Websol Energy System Ltd have declined from ₹305 cr in FY2014 to ₹17 cr in FY2023. Sales of the company have further declined to ₹1 cr in the 12 months ended September 30, 2023, i.e. during Oct. 2022-Sept. 2023.
Over the years, the sales performance of Websol Energy System Ltd has been very fluctuating. From FY2015 to FY2019, sales declined from ₹356 cr to ₹69 cr. Subsequently, the decline continued and the company has almost completely stopped its business since FY2023.
The operating profit margin (OPM) of the company has also fluctuated significantly over the years. OPM was the highest 22% in FY2021 whereas it reported operating losses during FY2019 and FY2023. At the net profit (PAT) level, Websol Energy System Ltd reported net losses in 5 out of the last 10 years.
To understand the business model of the company better, let us analyse the profit performance of Websol Energy System Ltd over the last 28 years (FY1996-FY2023).

Over the last 28 years, the performance of Websol Energy System Ltd has been very erratic. Frequently, sales declined over previous periods and more importantly, the company faced long periods of continuous losses like FY1996-FY1999 and FY2012-FY2016.
The business performance of Websol Energy System Ltd has been very poor and cumulatively over the last 28 years (FY1996-FY2023), the company has lost money by reporting a net loss of ₹250 cr.
To understand the reasons for such performance of Websol Energy System Ltd, an investor needs to read the publicly available documents of the company like annual reports from 1997 onwards, credit rating reports, as well as its corporate announcements.
After going through the above-mentioned documents, an investor notices the following key factors, which influence the business of Websol Energy System Ltd. An investor needs to keep these factors in mind while she makes any predictions about the performance of the company.
1) Intense competition among solar cells and module manufacturers:
Websol Energy System Ltd faces strong competition, especially from Chinese and Taiwanese manufacturers, which have over the years increased their global market share by quickly installing large solar cells and module manufacturing capacities.
In 2009, China and Taiwan controlled almost half of the world’s solar cell manufacturing capacity (49%), which increased further to 59% in 2010.
FY2011 annual report, page 16:
Producers in China and Taiwan accounted for 59% of the global cell production in 2010 (49% in 2009).
The two countries have continuously added capacities in both solar cells and modules. In 2016, China and Taiwan had 69% of solar module manufacturing capacity.
FY2016 annual report, page 4:
China and Taiwan account for over 69% of global module supplies.
In fact, China had created so much excess capacity over its domestic requirements that in FY2017, it could complete its solar power installation targets for the full year within the first 6 months. Thereafter, large Chinese cell and module manufacturers could only target foreign markets by resorting to dumping their products at very low prices.
FY2017 annual report, page 8:
China achieved majority of its FY17 solar capacity addition target in the first half of the year itself, leaving PV manufacturers with a large under-utilized production capacity that made it possible to dump in other countries
FY2019 annual report, page 7:
heightened price erosion on account of increased product dumping by China comprised the main challenges
This severe competition from Chinese and Taiwanese manufacturers is in addition to the competition from domestic, Indian manufacturers. In recent years, Indian govt. is focusing on significant additions to solar power. Therefore, many corporate houses with strong financial positions have entered solar cells & modules manufacturing, which has increased competition for Websol Energy System Ltd.
As per the FY2018 annual report of the company, page 20, about 18 companies manufactured solar cells in India led by Tata Power and Indo Solar. However, recently, big groups like Reliance, Adani and JSW have also entered into solar cell manufacturing, which will make this segment even more competitive.
- Tata Power to set up Mega Solar Manufacturing Plant in Tamil Nadu; Signs an MoU with State Government for INR 3,000 crore investment
- Adani plans to build 10 GW solar manufacturing capacity by 2027
- Reliance, Tata Power and JSW Energy among 11 companies to get solar cell manufacturing approval
2) Very low pricing power of Websol Energy System Ltd over its customers:
The intense competition in the solar cell manufacturing business has severely limited the negotiating power of Websol Energy System Ltd over its customers. As a result, it is not able to pass on an increase in its raw material costs to its customers.
In FY2006, Websol Energy System Ltd intimated to its shareholders that it could not pass on the increase in raw material costs to its customers.
FY2006 annual report, page 40:
Webel-SL is engaged in a volume-driven business with relatively thin margins where cost increases cannot be easily passed on to customers.
In FY2009, the company said that the market of solar cells and modules is completely a buyer’s market indicating that suppliers do not have negotiating power.
FY2009 annual report, page 15:
upto sept 2008, it was sellers market. Now it is buyers market.
On the other hand, whenever raw material prices decline, it has to pass on the benefits to its customers by reducing the prices of its solar cells and modules because the customers have plenty of options to choose their suppliers especially large Chinese suppliers who have many cost advantages.
In the FY2018 annual report, Websol Energy System Ltd highlighted that it has to match lower prices offered by Chinese producers even if it means lower profits or losses.
FY2018 annual report, page 6:
Over the last few years, some of the largest Chinese manufacturers commissioned some of the world’s largest solar cell and module capacities, a competitive positioning that made it possible for them to sell at progressively lower costs. As a result, there has been a virtual meltdown in realizations. This decline has made it imperative for manufacturers like us…to match Chinese prices
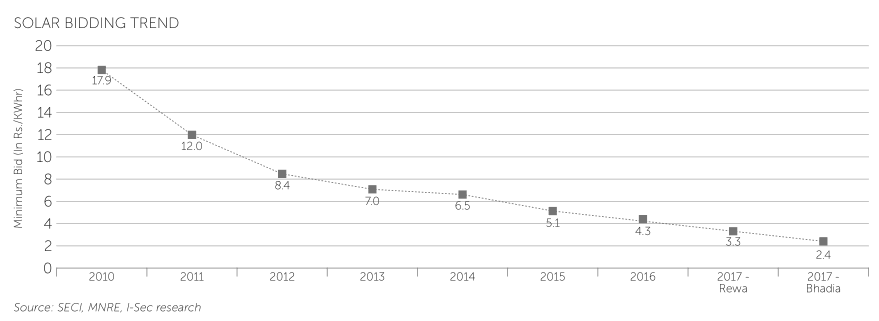
Cheaper imports from Chinese players have been one of the main reasons for a very sharp decline in the cost of solar power production in recent years. The bidding cost for solar power in India declined from ₹17.9 per unit in 2010 to ₹2.4 per unit in 2017.
FY2017 annual report, page 5:
The sharp reduction in solar cell and module prices has been one of the key reasons for the losses of Websol Energy System Ltd as it could not reduce its production costs sufficiently. For example, in FY2010, the company reported losses due to a fall in its product prices.
FY2010 annual report, page 37:
However, your company posted a loss in the last financial year, which…was mainly due to fall in the prices of SPV cells and modules globally
In the past as well, there were multiple times when it could not sell its products at the prevalent prices in many markets as its product prices were uncompetitive. For example, in FY2004, its sales declined as it stopped sales in multiple markets due to a reduction in prices there.
FY2004 annual report, page 3:
We discontinued supply to unremunerative geographies and consciously rationalised our turnover from Rs. 3439 lacs in 2002-3 to Rs. 2750 lacs in 2003-4.
In FY2007, it stopped selling its products in Europe due to the same reasons.
FY2007 annual report, page 35:
Company reduced its European markets exposure in 2006-7, following a decline in end-product realisations in that continent.
In recent years, imports from China as about 25% cheaper than the cells and modules produced in India, putting significant pressure on Indian companies like Websol Energy System Ltd.
FY2021 annual report, page 25:
pricing differential between the landed cost of Chinese solar products and our price of 25%
An investor must keep a close watch on the solar cell and module prices going ahead as a decline in product prices has the potential to disrupt the entire business model of Websol Energy System Ltd.
It is essential in light of large upcoming solar cell and module manufacturing capacities by big corporate houses in India because, as per the company, every doubling of manufacturing capacity leads to a 22% reduction in solar module prices.
FY2011 annual report, page 18:
price of PV modules reduced by 22% each time the cumulative installed capacity (in MW) doubled.
Also read: How to do Business Analysis of a Company
3) Very high technology risk faced by Websol Energy System Ltd:
The technology to manufacture solar cells and modules has seen frequent changes over the years, which have led to a drastic decline in the cost of solar power generation. Due to rapid advancements, Websol Energy System Ltd has always been under pressure to improve the efficiency of its products.
Multiple times, it tried to increase its ability to use a higher size of solar wafers to 6 inches and then to 8 inches to improve efficiency and reduce its costs.
FY1999 annual report, page 5:
adoption of the latest technology to process 6 inch wafers, your company has gained enormously by way of reduction in production costs.
FY2000 annual report, page 4:
adoption of the latest technology to process 8 inch wafers, your company has gained enormously by way of reduction in production costs
3.1) Increase in capacity of solar modules:
Similarly, over the years, it has continuously increased the capabilities of its solar cells to generate a higher amount of energy. For example, in FY2003, Websol Energy System Ltd increased the capacity of its solar modules from 90 watts to 120 watts.
FY2003 annual report, page 4:
we successfully evolved our product mix from 90-watt cells towards value-added 120-watt cells
By 2008, the company had increased the capacity of its modules to 220 watts.
FY2008 annual report, page 13:
We also developed 180 and 220 wattage products towards the latter part of the financial year.
However, despite its continuous efforts to increase the capacity of its solar modules, it was continuously behind the industry and customers’ expectations as during FY2008, many of its competitors were already producing 300-watt cells.
FY2008 annual report, page 17:
some Japanese manufacturers have extended to 300 watts…making it imperative for manufacturers like us to graduate to higher wattages.
To meet the industry’s expectations, by FY2011, Websol Energy System Ltd started producing modules of up to 245 watts.
FY2011 annual report, page 11:
On the module front, we increased wattage from 212 W to 245 W
3.2) Increase in solar cell efficiency:
Similarly, the company was continuously under pressure to increase the efficiency of its solar cells. By FY2006, it had achieved an efficiency of 15%.
FY2006 annual report, page 20:
During the year under review, the Company successfully enhanced its cell efficiency from 14% to 15%,
By FY2011, the company had improved its cell efficiency to 18.3%.
FY2011 annual report, page 6:
Improved and enhanced cell efficiency from 17.8 % to 18.3%
However, the latest technology in 2011 was able to provide an efficiency of up to 44%.
FY2011 annual report, page 38:
most efficient photo-voltaic technology available today is multi-junction concentrators. These are three-junction and two-junction devices that currently offer up to 44% energy conversion efficiency.
Nevertheless, by FY2018, Websol Energy System Ltd has further increased its cell efficiency to 18.8%.
FY2018 annual report, page 10:
Company shifted from four bus-bars to five, increasing its efficiency from 18.5% to 18.8% by using multi-crystalline silicon cells
3.3) Increase in production yields:
Apart from a focus on the capacity of its solar modules and the efficiency of its solar cells, the company had to continuously focus on increasing its wafer yield to improve its production efficiencies.
In FY2006, the company achieved a yield of 90% in its production process.
FY2006 annual report, page 36:
Increased wafer yield from 85% to 90%
By FY2008, it had increased its yield to 94%.
FY2008 annual report, page 17:
we enhanced our yield from 85% (using reclaimed technology) to 94% (using solar-grade material)
By FY2022, the company has further improved its yield to 96.5%.
FY2022 annual report, page 18:
During the course of the last financial year, the Company enhanced process yield from 95% to 96.5%, the highest in its existence.
Recommended reading: How to study Annual Report of a Company
3.4) Tie-up with foreign and Indian institutes of excellence:
During this journey of continuously improving its products, Websol Energy System Ltd took the help of many foreign and Indian collaborators.
The company started its business in 1994 by sourcing technology from Helios, Italy.
FY2005 annual report, page 48:
company’s collaboration with Helios (from 1994 to 2001) enabled it to access the world’s best technology
In FY2004, the company tied up with a German university (the University of Konstnz and Fraunhauffer Institute in Germany) and a Japanese technocrat for technology.
FY2004 annual report, page 20:
Its R&D is supported by a university in Germany as well as a technocrat from Japan who advise it on technology
FY2005 annual report, page 48:
This team led by the Technical Director appraises modern-day technologies in consultation with University of Konstnz and Fraunhauffer Institute in Germany who advise the company to invest selectively in upcoming technologies.
In FY2018, Websol Energy System Ltd tied up with the Indian Institute of Technology, Mumbai and the Indian Institute of Engineering Science and Technology (IIEST), Shibpur for product improvements.
FY2018 annual report, page 10:
Company is collaborating with IIT Bombay and IIEST Shibpur in order to fine-tune process and increase yields.
However, despite all its best efforts, the company suffered significantly due to technology changes multiple times either its choice of technology was wrong or what worked for the company initially, stopped working later and it had to write off significant amounts of investments in the older technology. No wonder that in its history, Websol Energy System Ltd defaulted multiple times to lenders, was declared a non-performing asset and at one point in time, none of the banks was willing to give it a loan.
3.5) Significant write-offs due to the technology of Websol Energy System Ltd becoming obsolete:
There were occasions when the company proudly intimated to shareholders the very superior benefits of its existing technology. However, soon, it realized that what it once thought was the best technology has now become a burden on it. As a result, it had to scrap and write off its investments in its existing production technology.
For example, Websol Energy System Ltd started its business with reclaimed technology in which it used silicon wafers, which were rejected by the semiconductor industry.
The company highlighted to shareholders that its semi-automatic plant working on reclaimed technology is among the best in the world as it allowed it to have lower manufacturing costs, it could work with a wider range of silicon wafers and easily switch between different cell sizes.
FY2005 annual report, page 22:
I would say that our biggest competitive edge is the expert use of the reclaimed technology, which translates into a lower cost of raw material and a lower cost of conversion.
FY2006 annual report, page 19:
a prudent mix of automated and manual processes compared with the larger companies that are largely automated…our process is more tolerant of raw material variations than the automated giants…we can switch between cell sizes quicker, we can tweak our production lines faster to produce a wider product variety.
FY2007 annual report, page 28:
reclaiming technology enabled buyers like us to purchase and work with inferior-grade silicon rejects from semi-conductor manufacturers.
However, the next year, FY2008, it realized that the semi-automatic plant based on reclaimed technology was not proving to be as beneficial as it had thought. Therefore, in FY2008, it shifted from a semi-automatic plant based on recycled/reclaimed technology to a fully automatic plant based on crystalline silicon.
Websol Energy System Ltd told its shareholders that its previous technology (recycled/reclaimed technology) was challenging and costly. Therefore, it shifted its production technology.
FY2008 annual report, page 14:
We are moving from the challenging use of reclaimed technology to impart uniformity to solar-grade raw material
FY2011 annual report, page 11:
previous technology which we installed was costlier in terms of conversion costs and productivity.
Nevertheless, in FY2008, the company shifted from using recycled/reclaimed silicon in semi-automatic plants to using virgin solar-grade crystalline silicon in fully automatic plants.
FY2008 annual report, pages 14-16:
We are moving from a combination of manual- automated technology to fully automated technology.
We switched from the use of reclaimed to solar-grade raw material
Due to this switch, the company had to write off the significant investment done by it in getting certifications for its previous technology.
FY2008 annual report, page 12:
a switch in our technology in the last quarter and the write-offs required to make for certifications, which will reflect in our performance in 2008-09 and beyond
In FY2015, the company did a significant write-off of more than ₹50 cr of its assets at both its Salt Lake plant as well as Falta plant.
FY2015 annual report, page 51:
The Company has recognized diminution in the value of certain fixed assets pertaining to the erstwhile factory situated at Salt Lake and also installed at falta plant and as such discarded the obsolete / unusable fixed assets having the cost of ₹5759.10 Lacs and accumulated Depreciation of ₹ 1988.07 Lacs.
In FY2017, it once again wrote off assets of about ₹11 cr.
FY2017 annual report, page 56:
During the year Company has Discarded its fixed asset i.e plant and machinery from its use having gross value of ₹14.68 Crs. And written down value amounting to ₹11.03 Crs, thereby making losses worth ₹11.03 Crores for the Company
After a few years, the company realized that the new technology that it had invested in was no longer useful. As a result, it had to again switch its entire technology and scrap its entire existing plant & machinery.
FY2022 annual report, pages 7, 14 and 19:
Due to present technology becoming obsolete, no capex additions were done
During the current year and the next, the Company will graduate from the multi-crystalline technology to Mono PERC and TOPCon…This decision is warranting a complete replacement of the Company’s erstwhile equipment
Our Company is scrapping old machines
As a result, in FY2023, the company reported a decline of sales by about 90% over FY2022 and in the last 12 months (Oct. 2022 to Sept. 2023), the company has reported almost nil sales and significant losses.
The pace of innovation and upgrade of technology is significant in the solar power generation field. There have been radical innovative ideas like solar fabric where even clothes like t-shirts, coats etc. can generate solar power.
FY2021 annual report, page 35:
Solar fabrics Researchers are developing solar fabrics with a vision of including solar power in each fiber. These solar filaments can be embedded into t-shirts, winter coats, or any other clothing to keep warm, power the phone
In the past, there have been attempts to develop solar cells from plastic polymers and ink on aluminium foils.
FY2011 annual report, page 15:
certain companies declared their plans to produce solar cells using polymer plastics and solar-absorbing inks printed on aluminum foil.
Also read: How to do Business Analysis of Solar Power Plants
4) Multiple instances of financial default by Websol Energy System Ltd:
Companies with modest financial strength like Websol Energy System Ltd that do not have the resources to lead the research & development (R&D) in the industry, generate new technologies, and therefore, have to follow the industry for technology, might always be behind the curve.
Such companies might continue to face situations where they make large investments in one technology only to realize after a few years that the industry has moved on to another technology and as a result, would have to scrap the investment in existing technology.
As a result, of such a shift in technologies as well as due to the loss of competitive advantages, Websol Energy System Ltd faced severe financial weakness on multiple occasions leading to a default to lenders and resultant bankruptcy.
First, in 1999, the company defaulted to its lenders ICICI and IDBI and was referred to the Board of Financial and Industrial Reconstruction (BIFR). Both the lenders had to restructure their loans to the company.
FY1999 annual report, pages 3 and 9:
Company has made a reference to the Board of Financial and Industrial Reconstruction
I.D.B.l and I.C.I.C.I, have agreed to restructure the financial liabilities whereby interest rates shall be reduced
Over FY2001 and FY2002, ICICI and IDBI agreed to take losses and entered a one-time settlement (OTS) with Websol Energy System Ltd.
FY2001 annual report, page 15:
The company has entered in one time settlement with ICICI for all the dues as on 31st March 2001. This has resulted in a net waiver of interest for Rs. 34.77 lacs
FY2002 annual report, page 19:
The company his entered into a settlement with IDBI for all the dues as on 31st March 2002. This has resulted in a net waiver of interest & other charges amounting to Rs. 30.89 lacs.
Thereafter, in FY2009, the company faced severe stress on liquidity. As a result, it could not pay its suppliers, which led the suppliers to cash the letters of credit (LC) provided by Websol Energy System Ltd, called LC devolvement.
Credit rating report by CARE, March 2009, page 1:
pressure on liquidity of the company leading to relatively low current ratio & few instances of L/C devolvement
Also read: Credit Rating Reports: A Complete Guide for Stock Investors
Thereafter, in FY2012, the company again defaulted to its lenders and its lenders had to restructure their loans. However, three banks refused to restructure their loans.
FY2012 annual report, pages 6-7 and 48:
we had to renegotiate debt as interest rates remained high. In March 2012, we underwent bank restructuring in which our working capital loans were converted to term loans…The capex loans were also restructured
three working capital provider Banks viz., Standard Chartered Bank, Dena Bank and HDFC Bank and one term lender viz., EXIM Bank have not restructured the credit facilities.
In FY2013, the company was declared a non-performing asset (NPA) by lenders and it was referred to BIFR.
FY2013 annual report, page 4:
these three working capital lenders as also the other two working capital lenders i.e., Allahabad Bank and Federal Bank have classified your company’s borrowings as Non Performing Asset (NPA)…and registered with the Board for Industrial and Financial Reconstruction (BIFR)
In FY2016, Allahabad Bank and Dena Bank sold their loans to Websol Energy System Ltd to asset reconstruction companies (ARCs).
FY2016 annual report, page 7:
Allahabad Bank and DENA bank has been assigned to ARCs.
FY2016 was a particularly tough year for the company as one of its suppliers also filed a case against the company to recover its money.
FY2016 annual report, page 51:
A Creditor has filed a suit against the company before honourable high court at Kolkata for recovery of ₹ 20 lacs.
In FY2017, the company entered a one-time settlement (OTS) of dues with its bankers, who accepted losses on their amounts due.
FY2017 annual report, page 12:
During the year your company has settled all NPA bank accounts through OTS.
In light of such a poor repayment track record of the company, it does not come as a surprise to an investor that banks refused to give loans to the company and due to a lack of banking facilities, it could not even pay its regular undisputed statutory dues.
FY2018 annual report, page 27:
delay in payment of undisputed statutory dues mentioned…it is submitted that it was due to the continuous adverse financial condition and no banking facility currently available to the Company
In FY2020, Websol Energy System Ltd defaulted in payments to the ARC to whom banks had assigned their loans of the company. As a result, the ARC sold its properties and recovered the money.
FY2020 annual report, page 65:
Company has one lender Invent Assets and Reconstruction Co. Pvt. Ltd…The Company made default in repayment of loan for the quarter ended December, 2019. The lender sold the non core assets of the company and realized their installment for December, 2019 along with future Installments.
In FY2021, the company again defaulted to its lender and did not make repayment even after a delay of 11 months.
FY2021 annual report, page 94:
Company has currently failed to make timely repayment of its principal outstanding of Rs 301.96 lakhs as against working capital loan repayable on demand from Invent Assets and Reconstruction Co. Pvt. Ltd. which has been recalled by the lender via a letter dated 4th May, 2020 and is not yet repaid by the company as on 31.03.21. i.e. period of default of 11 months.
Considering these continued periods of financial stress where many of the company’s lenders had to take losses on the loans given by them to the company, an investor is fascinated to read the following statements in its recent annual reports.
FY2018 annual report, page 7:
Websol is possibly among only a handful of Indian solar energy product manufacturing companies to be viable and profitable.
FY2022 annual report, page 2:
Endured through various market, policy and technology cycles. Liquid, profit-making and debt-free today.
FY2023 annual report, pages 16 and 22:
In a high-mortality business, your company has emerged as a competitive survivor
The under-borrowed Balance Sheet is expected to protect business sustainability
Nevertheless, in 2023, the company had planned to raise money by diluting its equity using preferential allotment of shares. However, after getting the board and shareholders’ approval, it had to shelve the proposal as it faced challenges in creating a “lien” on its shares, which were already pledged with lenders.
Q1-FY2024 results, August 2023, page 1:
We would like to withdraw the earlier preferential allotment of equity share proposal. The earlier proposed preferential allotment…could not be completed within the time…majorly on account of administrative difficulties in getting ‘lien’ on already pledged securities of the promoter group entities.
Recommended reading: How to do Financial Analysis of a Company
5) Very high regulatory/government policy risk faced by Websol Energy System Ltd:
The solar power industry is heavily dependent on the govt. and its policy decisions both for the sale of power, production incentives as well as support/barriers via tariffs.
Originally, the demand for solar power was primarily driven by the subsidies offered by govt. on the use of solar power both in India and overseas.
FY2003 annual report, page 26:
industry is largely dependent on government purchases and subsidy.
In India, at the start of this millennium, the use of solar power was primarily limited to solar lights, lanterns and water pumps where the purchase of equipment was subsidized.
FY2004 annual report, page 14:
usage is concentrated across home and street lighting, solar lanterns and water pumps for irrigation.
India govt. incentivized the use of solar power by way of soft loans with subsidies on interest payments via agencies like the India Renewable Energy Development Agency (IREDA).
FY2005 annual report, page 35:
In India the government initiated soft loan schemes to promote the use of solar energy. The soft loan programme under an interest subsidy scheme is being implemented through India Renewable Energy Development Agency (IREDA) and public sector banks
It was the regulatory push by agreements like the Kyoto Protocol, which increased the demand for solar power and equipment benefiting Websol Energy System Ltd.
FY2006 annual report, page 39:
Company’s topline grew from Rs 56.63 cr in 2004-05 to Rs 68.18 cr in 2005-06, influenced by an increased demand for the product following the acceptance of the Kyoto Protocol in February 2005
The growth in the use of solar power in major overseas markets like Europe was also supported by subsidies from govt. As a result, when the European govts. cut down subsidies, around 10 years back, then, suddenly, the demand for solar cells and modules in Europe declined. This was the time when China was adding large-scale solar manufacturing facilities and as a result, the global market saw significant oversupply leading to a crash in the prices of solar cells and modules.
Therefore, in FY2012, Websol Energy System Ltd had to sell its products at losses i.e. below the production cost. This impact lasted many years as Websol Energy System Ltd consecutively reported net losses for the next five years (FY2012-FY2016).
FY2012 annual report, page 8:
One, the market growth tapered and European subsidies declined and a slowdown on the continent translated into staggered offtake. Two, low-cost Chinese products threatened the profitability of most manufacturers, Websol included.
there was a sharp downturn leaving a huge unsold industry inventory across a number of European ports, which triggered a price meltdown. Your Company could not escape the situation; it was compelled to reduce the price of some stock while it was in transit to below production cost.
Due to global oversupply, many countries like the USA, as well as Europe, put barriers like increased duties on imported solar cells and modules, which impacted manufacturers in China as well as India like Websol Energy System Ltd.
FY2012 annual report, page 7:
US has imposed anti-dumping duties on China, which owns 70% of the global PV capacity because of its sheer size and governmental support.
In FY2018, the USA put a safeguard duty on the import of solar equipment from India, which impacted the demand for companies like Websol. It contributed to the sharp decline in the financial performance of the company in FY2018 when its sales as well as profits including margins declined significantly.
FY2018 annual report, pages 8-9:
The Company needed to address the reality of US Safeguard Duty on export of solar cells and modules from India
During such phases of oversupply and cheaper imports, Indian govt. has also supported its solar equipment manufacturers by putting an anti-dumping duty on imports. In addition, it mandated the use of domestically produced equipment for solar power plants in India.
FY2014 annual report, page 1:
Government department has already initiated the imposition of anti-dumping duty on imports of solar cells and modules and has at the same time outlined the requirement of domestic content under various solar schemes to revive the industry.
However, the life of companies like Websol Energy System Ltd was not easy even after the govt. support because it led to a trade war between the USA and India where the USA wanted India to abolish its requirement of domestic content.
FY2015 annual report, page 7:
The US has taken its battle to get India to open its solar market to the World Trade Organisation. At the heart of the battle is the stipulation for “domestic content requirement” (DCR) in Phase II of the JNNSM program…as it would discriminate against US exports.
Govt. of India has implemented various other measures also to support solar equipment manufacturing in the country like subsidies on capital equipment for making solar cells.
FY2015 annual report, page 8:
20% and 25% subsidy on capital expenditure has been announced for entities establishing cell and module lines in Special Economic Zones (SEZ) and Non-SEZs, respectively.
In addition, the govt. also gave multiple tax incentives to promote the use of solar power.
FY2017 annual report, page 8:
Indian Government offers several tax and financial incentives to support the rooftop solar market including a 30% subsidy for residential and institutional consumers, 80% accelerated depreciation, 10-year tax holiday
Recently, the govt. is incentivizing the production of solar equipment in the country by providing production-linked incentives (PLI).
FY2022 annual report, page 43:
government allocated Rs19,500 crore (USD 2.57 billion) for a PLI scheme to boost the manufacturing of high- efficiency solar modules.
However, it is not that all the govt./regulatory decisions have been in the company’s favour. In FY2018, the solar equipment industry was impacted by many tax increases.
FY2018 annual report, page 21:
Threats: Solar companies have been hit by several tax increases. From July 2017, developers have had to pay 5% under the new GST regime on solar equipment, while some ports are charging an additional 7.5% import duty on panels from abroad.
In fact, in FY2020, the company faced a strongly adverse regulatory environment and had to stop production to avoid further losses.
FY2020 annual report, page 13:
The Company needed to address the reality of US Safeguard Duty on the export of solar cells and modules from India, customs duty on imported solar energy equipment and the quantum of local content in solar energy projects. In this challenging environment, the Company prudently selected to stop manufacture…protected the Company from a larger financial burden.
Also read: How to analyse New Companies in Unknown Industries?
6) Continuous efforts by Websol Energy System Ltd to lower its operating costs:
Due to continuous pressure on the pricing and demand of its products, Websol frequently reported losses in its business. As a result, to strengthen its business, the company took many steps to reduce its operating costs.
6.1) Increase the size of operations for the benefit of economies of scale:
One of the key strategies followed by solar equipment manufacturers globally is to increase their size so that they can benefit from lower production costs due to economies of scale, which allows the spreading of fixed costs over a larger number of units produced.
Websol Energy System Ltd also realized that in this intensely competitive industry where product prices are on a very sharp declining trend if a company does not expand to reduce its operating costs, then it would be very difficult for it to survive.
FY2008 annual report, page 23:
It is the management’s considered opinion that if it had not scaled its business, it would have been marginalised in a business marked by rapidly increasing capacities. In effect, other faster-growing companies would have achieved lower production costs and potentially out-priced the Company…In staying small, the ability of the Company to absorb price declines would have been lower, threatening its existence.
Therefore, Websol Energy System Ltd continuously attempted to increase its business size.
- In FY2003, it increased its manufacturing capacity from 2.5 MW to 5.0 MW.
- In FY2006, it increased the capacity to 10 MW.
- In FY2010, it increased its capacity further by 30 MW by installing a unit in Falta SEZ.
- In FY2011, it further increased its capacity to 60 MW.
- In FY2012, it increased its capacity to 120 MW
- In FY2017, the company increased its production capacity to 200 MW and
- In FY2018, it scaled its capacity to 280 MW.
Moreover, currently, the company has scrapped its entire existing manufacturing capacity as its technology has become obsolete and it is now expanding capacity to 1800 MW across multiple phases using the latest technology (1,200 MW Mono PERC and 600 MW TopCON).
In addition to increasing its manufacturing capacity for lower costs, the company tried to improvise on the process of capacity expansion to save on costs.
For example, in FY2003, when it expanded its capacity from 2.5 MW to 5.0 MW, it did not give a turnkey contract to its foreign collaborator. Instead, it purchased critical equipment from abroad and then did the fabrication of many equipment on its own and then implemented the expansion at a much lower cost.
FY2003 annual report, page 5:
company expanded its capacity (from 2.5MW to 5.0 MW) at a seventh of the original cost?…we fabricated a number of our capital assets and complemented them with critical imported equipment. This enabled us to reduce our project cost to the minimum
Moreover, the company improvised further on the utilization of space in its building and it could fit in the plant with a manufacturing capacity of 10 MW in the space, which was originally supposed to fit in only 2.5 MW.
FY2005 annual report, page 22:
we succeeded in fitting a 10 MW capacity into a space originally designed for only 2.5 MW by building vertically on our existing premises.
However, it seems that soon the company realized that its strategy of installing the manufacturing capacity on its own is not working properly. Therefore, for its 30 MW expansion plan in 2008-2010, it handed over a turnkey contract to Centrotherm Photovoltaics, a German company.
FY2008 annual report, page 17:
Centrotherm Photovoltaics has been entrusted the turnkey responsibility of commissioning our expansion and accelerating the scale-up.
However, shortly after this unit was completed in FY2010, it suffered a major breakdown seriously impacting the operations of the company.
FY2010 annual report, page 63:
Company has started the commercial production of its 30MW unit situated at Falta SEZ. However a major break-down happened during the month of March and April 2010 thereby affecting revenues of the last two quarters.
6.2) Changes in raw material sourcing strategies:
Over the years, Websol Energy System Ltd has continuously faced challenges in sourcing raw materials. At some times, it was sharply increasing the cost of raw materials and at other occasions, it was non-availability of raw material.
The company had to scrap its existing machines with old technology and invest a large amount of money in new technologies whenever the availability of raw materials became a challenge. For example, when it shifted from recycled silicon technology to virgin-crystalline silicon technology in 2008-2010, one of the reasons for the shift was scarcity of recycled silicon.
FY2010 annual report, page 8:
Company took a prudent call and decided to shift to a new technology as growing production and accessing a larger quantity of recycled silicon wafers was not going to be sustainable.
However, on other occasions when the price of silicon wafers increased significantly, it took steps like relying more on domestic suppliers instead of imported material, which could lead to saving in transportation as well as storage costs.
FY2023 annual report, page 41:
60% of our raw materials are sourced from Gujarat, which translates to just a ten-day transit period and a consequent reduction in working capital expenditure.
In the meanwhile, Websol Energy System Ltd also attempted to get into long-term sourcing agreements by forming joint ventures (JV) with foreign suppliers.
FY2008 annual report, page 37:
To ensure a smooth supply of adequate quantity of Silicon Wafers, your Company has formed a joint venture with Micro Power Trading Co. Pte Ltd, Singapore for the procurement of Silicon Wafers under a contract entered into with the said Company for a period of three years
The company even envisaged backward integration and setting up a manufacturing plant under the Singapore JV for slicing of silicon ingots.
FY2008 annual report, page 62:
A Joint Venture with M/s Micro Power Trading Co. Pte Ltd, Singapore during the year has been formed for sourcing of Silicon Ingots and setting up a plant for slicing thereof to be used in the manufacture of Silicon Wafers
On other occasions, the company attempted to tweak the kind of raw material that it used so that it could lower its manufacturing costs like relying on mono-like wafers focused on cheaper solar cells.
FY2012 annual report, pages 7 and 11:
We ventured into the production of mono-like wafers, which are typically low-priced, to enter the lower end of the market.
Company focused on reducing raw material costs by 10-15% through the use of alternative raw materials.
The company also tweaked the quality of screens used in making solar modules, which helped in the reduction of costs as it saved on the use of silver in the process.
FY2022 annual report, page 18:
Company upgraded the quality of screens used in manufacture. This helped moderate the consumption of silver from 95 mg per wafer to 75 mg per wafer, generating savings of Rs1.5 crore.
Similarly, it used other strategies like using thinner silicon wafers (< 200 microns instead of 400 microns) and reducing consumption of other chemicals to reduce production costs.
FY2007 annual report, page 27:
We fine-tuned process line equipment and tweaked operating practices to process thin wafers (thickness below 200 microns from the previous 400 microns) using in-house capability…We lowered the chemicals consumption, which enabled us to partially offset the increase in raw material costs.
However, despite all these strategies to save on manufacturing costs over the years, Websol Energy System Ltd found it difficult to compete with large overseas manufacturers who could sell their products at very cheap prices. As a result, it had to repeatedly default to its lenders.
7) Changes in its delivery models in the business to stay relevant to customers:
Over the years, Websol Energy System Ltd attempted to make many changes to its business model so that it could provide more value to customers in order to stay relevant to the customer in light of intense competition.
For example, during FY2007 and FY2009, it set up offices across key markets in the USA and Germany and planned to set up module assembly units in the US, Europe, Australia etc.
FY2009 annual report, page 14:
We have set up a representative office in Germany and United States
FY2007 annual report, page 29:
We expect to commission module installers across some of the key locations in the US, EU and Australia, among others. We expect to ship the semi-knocked down unit (SKU) to these locations from where the module will be assembled and despatched.
The company also attempted to create warehouses overseas and enabled just-in-time delivery of its products to customers.
FY2005 annual report, page 19:
At Webel-SL, this service comprised the following: A just-in-time delivery helping international customers manage their onward delivery, assembly and inventory costs.
FY2011 annual report, page 12:
Low transportation cost: The Company generated more than 95% of its revenues from exports supported by warehouses in Europe to reduce logistics cost and accelerate product delivery.
The company even planned forward integration by becoming a solar farm-creating company.
FY2011 annual report, page 8:
we expect to evolve from a solar cell manufacturing company to one that is a cell manufacturing-cum-solar farm-creating company…we intend to commission a solar farm by the end of 2012
It even attempted to create a retail business by selling smaller solar modules through outlets of Exide Ltd.
FY2018 annual report, pages 9 and 11:
During the last year, we recognized that our long standing B2B business model, marked by competitive pricing, would need to be adapted… to extend our focus from wholesale marketing to wholesale-cum-retail marketing
The Company inked a contract with Exide to bolster retail revenues. Furthermore, the Company is leveraging the widespread network of Exide to sell its own products at a fraction of the cost
Websol Energy System Ltd also thought of becoming an engineering, procurement and construction (EPC) company.
FY2023 annual report, page 19:
Company intends to enter the EPC segment of the business across the foreseeable future.
Nevertheless, when many attempts of the company to grow its business profitably were not working, it started a contract manufacturing/tolling business for a Chinese solar equipment manufacturer where Websol made cells and modules in the name of the Chinese company.
FY2023 annual report, page 7:
2011-12: Engaged in a tie-up with Renesola (China) for two years to produce cells and modules in their name
Also read: How to do Business Analysis of a Company
8) Foreign exchange fluctuations have a serious impact on the company’s business:
Websol Energy System Ltd’s business is highly exposed to foreign exchange fluctuations both related to the Indian Rupee (INR) as well as, in the past, fluctuations between the US Dollar (USD) and Euro (EUR).
This is because, in the past, it used to rely entirely on imported raw materials as well as used to sell its entire production to foreign customers.
FY2005 annual report, page 22:
we import all our raw material and export nearly all our production.
It was the same case for almost all Indian solar cell & module manufacturers as they chased higher product prices in the export markets.
FY2012 annual report, pages 12-13:
More than 70% of cells and 80% of modules manufactured in India are exported…Manufacturers are mostly focused on export markets that buy SPV cells and modules at higher prices thereby increasing their profits.
Websol Energy System Ltd’s excessive reliance on imports and exports exposed it to forex fluctuations. In addition to fluctuations in INR with foreign currencies, it was also exposed to movements of USD-EUR as its raw material purchases (imports) were primarily billed in USD whereas its sales (exports) were primarily billed in EUR.
FY2010 annual report, page 35:
Around 90% of the imports contracts are through Dollar and the rest in Euro. Whereas for exports 90% of the contacts are in Euro and the rest in Dollar
However, despite high forex exposure in USD and EUR currencies, it seems that the company’s hedging strategy of entering into a forward contract for only a part of its exposure depending on its views about favourable Euro movements did not prove successful.
FY2010 annual report, page 35:
Company enters into forward contracts to cover about 20-25% of the contract value when the Euro is favourable.
This is because, on numerous occasions, the company suffered significantly due to forex fluctuations. For example, in FY2012, Websol Energy System Ltd suffered a large forex loss of ₹60 cr.
FY2012 annual report, page 6:
Volatility in foreign exchange affected profitability with the result that we suffered a forex loss of ₹60 cr in 2011-12.
Similarly, in multiple years, the company’s sales and profit margins suffered due to adverse forex fluctuations. Considering large forex losses as well as declining competitiveness, in recent years, Websol Energy System Ltd has changed its entire business model from exports to domestic sales.
FY2022 annual report, page 21:
Company derived 100% revenues in FY2021-22 from within India
Nevertheless, despite such domestic focus, the company is still exposed to forex movements because even in the domestic market, solar cells and modules are priced as per the landed cost of imports as well as imported raw materials.
FY2012 annual report, page 15:
with the focus on domestic market, the domestic finished goods pricing will be based on the prices of imported raw materials
Therefore, Websol Energy System Ltd comes across a company that is a market follower in technology and due to modest financial strength has suffered significantly in competition from international large solar cell and module manufacturers. The company had tried hard to stay profitable by making changes in its business model, raw material sourcing, products etc. However, it has suffered significantly due to rapid technological and regulatory changes leading to financial losses, asset write-offs as well as defaults to lenders.
Currently, it is in the middle of another large change where for the last 1.5 years, it has been upgrading its plant to new technology by scrapping its existing machinery. An investor should monitor whether it can complete the project within time and budget and if it can sell its goods profitably to justify the investment.
Before opting for the new tax regime in FY2020, the tax payout ratio of Websol Energy System Ltd was very low, almost nil up to FY2019. The major reason for the low tax payout ratio was accumulated losses of about ₹379 cr during FY2012-FY2016 and minimum alternate tax (MAT) credits.
For example, in FY2017 and FY2018, the company reported a very low tax payout because almost all the tax liability was set off against brought-forward losses in FY2017 and against MAT credits in FY2018.
FY2018 annual report, page 86:
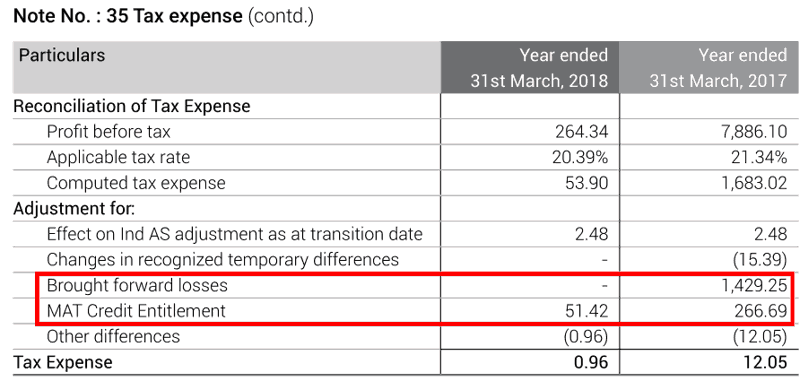
However, since FY2020, the company has shown a tax payout ratio in line with the recent changes in the corporate tax rates implemented by India.
FY2020 annual report, page 92:
Company has elected to exercise the option permitted under section 115BAA of the Income-tax Act…Consequently, MAT Credit-Deferred Tax Asset lapsed
Also read: Deferred Tax Assets, Tax Payout (P&L vs. CFO): Queries Answered
Operating Efficiency Analysis of Websol Energy System Ltd:
a) Net fixed asset turnover (NFAT) of Websol Energy System Ltd:
The net fixed asset turnover (NFAT) of Websol Energy System Ltd in the past years (FY2013-21) has declined from 1.2 in FY2015 to 0.9 in FY2022 (the last full year of operations of plants). In addition to the declining trend, an investor may also note that the NFAT of about 1 is low indicating a capital-intensive business model.
FY2007 annual report, page 42:
business of solar PVC manufacture is capital-intensive
Due to the capital-intensive business model, the company required a lot of money to run and expand its business. In addition, the company has made significant losses in the past indicating that its business has not produced sufficient resources to fund its capacity expansions. As a result, the company could not pay back its debt and was declared defaulter/NPA by its lenders.
In recent times, lenders took over its assets and sold them to recover their loans.
FY2014 annual report, page 33:
The Working Capital borrowing accounts of the Company continue to remain NPA…Allahabad Bank…has taken symbolic possession of the Salt Lake land which was given as collateral security
Going ahead, an investor should keep a close watch on the progress of the currently under-implementation project and see if the company can generate sufficient money from its profits to repay its debt taken from IREDA on time.
Further advised reading: Asset Turnover Ratio: A Complete Guide for Investors
b) Inventory turnover ratio of Websol Energy System Ltd:
Operations of Websol require a lot of investment in working capital. One of the reasons is a large inventory requirement because in the past it needed to stock imported raw materials for the smooth running of its operations. In addition, a long production cycle of solar cells and modules also requires a lot of investment in working capital.
FY2005 annual report, page 43:
The necessity to maintain a sizeable inventory of imported raw material to avoid disruption of the operations…the need to maintain a stock of a diverse product range till they achieve the economical level (container load) for exports…A production cycle of 120 days starting from raw material purchase to sales receipts
FY2006 annual report, page 42:
business became progressively working capital- intensive as the year progressed on account of the Company’s need to accumulate raw material
Another reason for the large inventory requirement of the company was its inability to secure a stable source of sufficient quantity of raw material. The prices of silicon wafers fluctuated significantly and it faced serious difficulties in securing supplies to the extent that it had to discard existing machinery and technology when it could not get raw material supplies.
As a result, to secure supplies, it had to pay its suppliers in advance, which made its operations further working capital intensive.
FY2005 annual report, page 23:
we are now making advance payments to secure our raw material availability.
At times, its operations suffered a breakdown, which led to the accumulation of inventory at its plant.
FY2010 annual report, page 32:
Also, during March-April 2010, the manufacturing activity was disrupted due to frequent breakdowns accounting for higher inventory levels.
In FY2012, the working capital condition of the company had deteriorated to such an extent that it could not even do business and had to deny orders. It faced inventory losses.
FY2012 annual report, page 6:
Despite rising demand, the Company had to deny orders because of absence of adequate working capital. We expect inventory losses to stabilise by 2012-13
On other occasions, it was stuck with a large inventory when customers deferred picking up the orders.
FY2019 annual report, page 8:
Increase in the inventory turnover ratio was mainly on account of large inventory in the form of modules which was not lifted by the customer.
An investor would appreciate that if a company ends up keeping a large inventory, then there is a higher probability that some of it will turn obsolete and will need to be written down.
Websol Energy System Ltd had to write down its inventory in FY2023.
Q4-FY2023 results, May 2023, page 9:
Exceptional items includes write down of inventory
Therefore, it seems that inventory management by Websol Energy System Ltd left a lot of scope for improvement. Going ahead, an investor should monitor the inventory management of Websol Energy System Ltd so that she can assess whether the company is utilizing its inventory efficiently or not.
This is important when an investor notices that, currently, the operations of the company are completely stopped and the plant in which production will happen is still under construction; however, as per the FY2023 annual report, the company has already stocked silicon wafers, silver paste and aluminium paste even before it could get the loan from IREDA for the plant in May 2023.
FY2023 annual report, page 41:
To secure the uninterrupted flow of manufacturing lines, the Company acquired 2.29 Million silicon wafers, 302 kg of silver paste, and 3790 kg of aluminum paste.
Further advised reading: Inventory Turnover Ratio: A Complete Guide
c) Analysis of receivables days of Websol Energy System Ltd:
Websol Energy System Ltd faced challenges in collecting its receivables. Originally, it used to rely mainly on govt. orders, which led to delays in collections.
FY2004 annual report, page 17:
In India, the renewable energy industry’s long payment cycles are a result of the influence and control of the Government.
As a result of long delays in payments, the company had to write off its receivables.
FY2004 annual report, page 11:
During 2003-4, we strengthened our balance sheet through a one-time write-off of bad debts
To save on such bad debt, the company attempted to shift its business model from supplying directly to govt. agencies, to now supplying to the contractors/integrators to govt. agencies in the hope that these contractors being private parties will clear payments faster.
FY2003 annual report, page 23:
The company sells its products to these integrators as opposed to direct sales to government agencies. This has enabled the company to enhance the quality of its income and turn around its working capital faster
However, even after many years, the company still had challenges in collecting receivables on time. In FY2015, the company was facing a lot of difficulties in collecting money from customers. In comparison to the total sales of the company for FY2015 (₹356 cr), it had about 55% (₹195.5 cr) receivables outstanding. Out of these receivables, about ₹107 cr were more than 6 months overdue and out of these ₹37 cr were overdue for more than a year.
FY2015 annual report, page 46:
Trade Receivables outstanding for a period exceeding twelve months: ₹37.7 cr.
Trade receivables outstanding for a period exceeding six months but upto twelve months from the date they became due for payment: ₹69.6 cr.
Trade receivables outstanding for a period less than six months from the date they became due for payment: ₹88.2 cr.
Looking at such difficulties in collecting money, it is no surprise for an investor to note that during this period, the company was declared an NPA by its lenders and they had to take losses on their loans and had to sell its assets to recover money.
Going ahead, an investor must keep a close watch on the receivables position of the company.
Further advised reading: Receivable Days: A Complete Guide
Therefore, Websol Energy System Ltd has a working capital-intensive business where it has large inventory requirements and significant outstanding receivables. It also faces a write-down of inventory and receivables (bad debt).
The Margin of Safety in the Business of Websol Energy System Ltd:
a) Self-Sustainable Growth Rate (SSGR):
Read: Self Sustainable Growth Rate: a measure of Inherent Growth Potential of a Company
Upon reading the SSGR article, an investor would appreciate that if a company is growing at a rate equal to or less than the SSGR and it can convert its profits into cash flow from operations, then it would be able to fund its growth from its internal resources without the need of external sources of funds.
Conversely, if any company attempts to grow its sales at a rate higher than its SSGR, then its internal resources would not be sufficient to fund its growth aspirations. As a result, the company would have to rely on additional sources of funds like debt or equity dilution to meet the cash requirements to generate its target growth.
An investor may calculate the SSGR using the following formula:
SSGR = NFAT * NPM * (1-DPR) – Dep
Where,
- SSGR = Self Sustainable Growth Rate in %
- Dep = Depreciation rate as a % of net fixed assets
- NFAT = Net fixed asset turnover (Sales/average net fixed assets over the year)
- NPM = Net profit margin as % of sales
- DPR = Dividend paid as % of net profit after tax
(For systematic algebraic calculation of SSGR formula: Click Here)
While analysing the SSGR of Websol Energy System Ltd, an investor would notice that over the years, the company had a negative SSGR primarily due to loss-making operations and low net fixed asset turnover.
As a result, over the years, the company had to raise debt from lenders as well as raise money by diluting equity from shareholders to fund its business requirements. Due to the inability of the business to generate sufficient cash, it defaulted to its lenders and its shareholders (existing and new) had to repeatedly infuse money into the company.
Over the years, there have been many occasions where it first raised loans from entities and then converted them into equity shares.
FY1999 annual report, page 5:
Company issued Equity Shares of Rs. 203.32 lacs towards convertion of Unsecured Loans
In FY2008, it raised about ₹120 cr by way of issuing global depository receipts (GDR: ₹54.4 cr) and foreign currency convertible bonds (FCCBs: ₹66.3 cr).
FY2008 annual report, page 35:
Company funded its Rs. 186-cr expansion project through the issue of 11,183,330 GDRs (worth Rs. 544 million) at USD 1.20 each, promoters’ contribution of Rs. 68.29 million and the issue of FCCBs worth Rs. 663 million.
In FY2010, the company again raised about ₹75 cr by way of qualified institutional placement (QIP: ₹45.4 cr) and warrants (₹30 cr).
FY2010 annual report, page 38:
During the year under review your Company has raised capital of Rs.45.40 cr. by way of QIP and further Preferential Warrants, convertible into equity shares, was also issued to the Promoter and Strategic Investor, amounting to Rs.30.00 cr.
In FY2011, the company raised about ₹25 cr from related parties by way of unsecured loans.
FY2011 annual report, page 44:
taken unsecured loans from four companies as covered in the register maintained under section 301…the balancing outstanding as at the date of the balance sheet was ₹2503.73 Lacs.
In FY2022, Websol Energy System Ltd raised ₹6 cr by issuing warrants to its promoter.
FY2022 annual report, page 90:
Company has also issued convertible warrants for an aggregate amount of ₹600.00 lakhs to one of its promoter on preferential allotment basis which were later on converted into 15,00,000 Equity Shares of the Company
In FY2023, the company allotted further shares to the promoter by converting its unsecured loan of about ₹11.75 cr and to an investor for ₹11.5 cr.
Corporate announcement at BSE, Nov. 2, 2022:
conversion of outstanding loan amount of upto Rs. 11,74,91,040/- by the Promoter allottee i.e., M/s. Websol Green Projects Private Limited and further infusion of funds of Rs. 11,54,52,000/- by the other allottee i.e., M/s. India Max Investment Fund Limited, the Board of Directors in their meeting held on today, i.e, 02.11.2022, have approved and allotted
In Oct. 2023, Websol Energy System Ltd allotted shares for conversion of the loan of about ₹14.66 cr by promoters and further equity infusion of about ₹23.52 cr by other investors.
Corporate announcement at BSE, Oct. 17, 2023:
conversion of outstanding loan amount of upto Rs. 14.66 crores by the Promoter allottees i.e., M/s. Websol Green Projects Private Limited and M/s. S.L. Industries Private Limited and further infusion of funds of Rs. 23.52 crores by the other allottees
Therefore, until now, the business of Websol Energy System Ltd has not shown any fundamental strength to generate resources to meet its funding requirements. The company raised loans from banks and other financial institutions, which it could not repay. As a result, the lenders had to accept losses, do one-time settlements, and sell its properties to recover loans.
Therefore, lenders became cautious and hesitant to fund Websol Energy System Ltd, which left equity dilution and unsecured loans from promoters as a major source of funds for the company and over the years, it has had numerous rounds of equity dilution.
Further advised reading: 3 Simple Ways to Assess “Margin of Safety”: The Cornerstone of Stock Investing
Additional aspects of Websol Energy System Ltd:
On analysing Websol Energy System Ltd and after reading annual reports, its credit rating reports and other public documents, an investor comes across certain other aspects of the company, which are important for any investor to know while making an investment decision.
1) Management Succession of Websol Energy System Ltd:
Websol Energy System Ltd was originally promoted by West Bengal Electronics Industry Development Corporation Limited (WEBEL) and Mr S L Agarwal in 1991 as WEBEL-SL Energy Systems Ltd. Later on, in 2000, WEBEL sold its stake in the company to Mr SL Agarwal.
FY2003 annual report, page 2:
WEBEL-SOLAR was jointly promoted by Webel, a West Bengal state government organisation, and S L Agarwal in 1991…In 2000, the former divested its stake in favour of the latter.
In FY2009, the company changed its name to Websol Energy Systems Ltd and thereafter, in FY2012, it changed its name to Websol Energy System Ltd (from Systems to System).
Currently, Mr S L Agarwal (age 77 years) is the chairman and managing director of the company and last year, his granddaughter, Ms. Sanjana Khaitan (age 26 years) joined the company as executive director and CFO of the company.
The presence of younger family members in executive positions within the group, while the senior member is still handling responsibilities, looks like a good succession plan. This is because the young member can learn about the fine nuances of the business under the guidance of a senior member until the senior decides to retire.
Further advised reading: How to do Management Analysis of Companies?
2) Remuneration of promoters of Websol Energy Systems Ltd:
In the past, there have been occasions when promoters of the company took a higher remuneration even though the performance of the company was not great.
For example, during FY2012 to FY2016, the company reported continuous losses. In fact, during these 5 years, the company reported a net loss of about ₹379 cr and it was defaulting to its lenders. However, during FY2015, the promoter of the company took a remuneration hike of 119% from ₹21.04 lac in FY2014 (page 10 of the annual report) to ₹46.16 in FY2015 (page 17 of the annual report). )Please note that there is a totalling error in this table done by the company in its annual report, which we have highlighted later in this article).
In FY2018, sales of the company had declined by about 38% from ₹296 cr in FY2017 to ₹183 cr and the net profit of the company declined by about 93% from ₹79 cr in FY2017 to about ₹5 cr in FY2018. However, in FY2018, the promoter took home a higher remuneration by 68% i.e. a remuneration of ₹64.02 lac (page 42 of the annual report) vs. ₹37.92 lac in FY2017 (page 30 of the annual report).
In FY2022, the net profit of the company declined about 80% from ₹49 cr in FY2021 to about ₹10 cr in FY2022. However, the promoter’s remuneration by 66% from ₹86.25 lac in FY2021 (page 77 of the annual report) to ₹129.51 lac in FY2022 (page 75 of the annual report).
An investor may also remember from the above discussion that these were the times when due to suboptimal performance of the company, it was defaulting to its lenders due to nonpayment of dues.
In FY2023, the company reported a net loss of ₹24 cr because it decided to scrap all its existing plant & machinery and started building a new plant with new technology by taking a loan from IREDA and equity dilution. Therefore, in the last 12 months (Oct. 2022 to Sept. 2023), it did not report any operating income. However, in FY2023, the promoter’s remuneration increased further to ₹132.45 lac (page 150 of the annual report).
Moreover, in the 2023 AGM of the company, it got approval for the appointment of the promoter’s 26-year-old granddaughter as executive director for a salary of ₹1 cr per annum and there might be other perquisites as decided by the board.
FY2023 annual report, page 67:
Salary: She shall receive a remuneration upto maximum of Rs. 1,00,00,000/- p.a.
Perquisite: For such amount as may be decided by the Board of Directors.
An investor may arrive at her own conclusion about this remuneration by considering the current size and financial performance of the company and the experience/profile of the executive director.
Also read: How to identify Promoters extracting Money via High Salaries
3) Related party transactions of Websol Energy Systems Ltd with promoter group:
Over the years, the company has entered into multiple transactions with the promoter group as well as with others for the benefit of promoters.
For example, in the corporate announcement to BSE on April 3, 2023 (click here), the company disclosed that it has provided a comfort letter for securing a loan against property taken by the company’s promoters from LIC Housing Finance Ltd i.e. almost a guarantee to LICHFL that if the promoters are not able to repay the loan, then the company will help repay them the loan to LICHFL.
Websol Energy System Limited (“the Company”) at its board meeting held on 3rd April, 2023 has provided comfort letter in favour of LIC Housing Finance Limited for securing the loan against property availed by Company’s promoters from LIC Housing Finance Limited.
In the FY2023 annual report, pages 148 and 149, the company disclosed that the letter of comfort is for ₹5.9 cr and are issued on behalf of Mrs Raj Kumari Agarwal who is the wife of promoter Mr S L Agarwal.
In FY2012, the company gave a loan to one of its related parties i.e. companies covered under section 301. However, it seems that the borrowing company did not repay its loan and as a result, Websol Energy Systems Ltd had to file a case in its efforts to recover the money.
FY2012 annual report, page 35:
The Company has, during the period under report, granted unsecured loan to one party covered under section 301 of the Companies Act, 1956…The receipt and payment of principal and interest has not been regular as per terms of the loan given and taken. In case of loan given, the company has initiated legal course.
An investor is intrigued that when the company’s own financial position is fragile that it from FY2012 to FY2016, it continuously reported large losses and then defaulted to lenders and is making its ends meet by raising money from debt and equity dilution, then why it is giving loans and guarantees/comfort letters for promoters and other companies.
Also read: How Promoters benefit from Related Party Transactions
4) Most of the partnerships formed by Websol Energy Systems Ltd did not last:
Over the years, the company entered multiple partnerships, business arrangements, joint ventures etc. However, most of them did not survive with some breaking apart within a year.
4.1) Solar Energy Power Pte Ltd, Singapore:
In FY2006, the company invested in Solar Energy Power Pte Ltd (SEPPL), Singapore as a part of a joint venture agreement to manufacture solar cells in Singapore and acquired a 49% stake in the company. It seems that SEPPL even started commercial production from its unit. However, within a few months, in June 2006, Websol Energy Systems Ltd got out of the joint venture.
FY2006 annual report, page 41:
Company deployed Rs 1.35 cr in a strategic investment to acquire a 49% stake in the Singapore-based Solar Energy Power Pte Ltd., a joint venture agreement to manufacture solar energy cells in Singapore. Following commercial operations in 2005-06, the Company decided to exit the venture and focus completely on its Indian operations. In view of this, the Company disinvested its complete stake in the joint venture in June 2006
4.2) Micro Power Trading Co. Pte Ltd, Singapore:
In FY2008, Websol Energy Systems Ltd entered into a JV agreement with Micro Power Trading Co. Pte Ltd (MPTCPL), Singapore for a long-term supply arrangement of silicon wafers for 3 years. The company made a significant investment including equity, loans and advance payments to MPTCPL.
FY2008 annual report, page 37:
A three year contract has been entered into with the said M/s Micro Power Trading Co. Pte Ltd, Singapore for supply of Silicon Wafers against which an amount of Rs.1,935.07 Lacs has been paid as advance deposit.
However, within two years, in FY2010, Websol Energy Systems Ltd cancelled the JV and called back its investment.
FY2010 annual report, page 63:
A Joint Venture with M/s Micro Power Trading Co. Pte Ltd, Singapore formed during the year 2008 for sourcing of Silicon Ingots/ Wafers has since been withdrawn and the Company has initiated steps to call back the investment made in the Joint Venture.
4.3) Joint venture in Germany, Websol Energy System Europe KG:
In FY2012, the company made a joint venture in Germany, Websol Energy System Europe KG. However, it cancelled the JV within FY2012 itself i.e. within a few months.
FY2012 annual report, page 35:
has investment in a Joint Venture situated in Germany during the period under report…The Joint Venture has been called off prior to the date of the balance sheet
The company could not recover its investment in the JV and as per the FY2018 annual report, pages 74 and 75, it had to write off its investment in the JV.
4.4) Contract with Exide Industries Ltd to sell products to retail customers:
In FY2018, Websol Energy Systems Ltd entered a contract with Exide Industries Ltd to sell its products via retail outlets of Exide.
FY2018 annual report, page 11:
The Company inked a contract with Exide to bolster retail revenues. Furthermore, the Company is leveraging the widespread network of Exide to sell its own products at a fraction of the cost
However, in the FY2021 annual report, the company intimated that the relationship with Exide has turned bad and Exide has filed a case against the company. Also, it had to create a charge on its raw material and Falta SEZ unit in favour of Exide to guarantee its performance obligations.
FY2021 annual report, pages 108 and 122:
Contingent liabilities: Includes Rs 214.20 lakhs against claim of Exide Industries Ltd (to the extent for which provision has not been made in the books) against an outstanding litigation.
Charge created for Rs 3000.00 lakhs over raw material and fixed assets lying at manufacturing unit at Falta for performance obligation of an agreement entered into with Exide Industries Ltd
After multiple failed business arrangements and joint ventures, in FY2023, the company entered a new JV with AMP Energy India Private Limited, Canada in which it plans to hold 51% and produce solar cells and modules at its unit in Falta.
BSE announcement, Sept 7, 2022:
joint venture agreement executed with AMP Energy India Private Limited dated 31st August, 2022
Parties to undertake production of up to 1.2 GW of monocrystalline PERC solar cells and up to 1.2 GW of mono PERC modules
proposed shareholding in the new joint venture will be Company- 51% and AEI- 49%
AEI to offtake 50% of the production; 50% production to be sold in the market
An investor may contact the company directly to know the updated status of this JV and monitor its progress closely in light of the very short life seen by its past joint ventures.
Also read: Steps to Assess Management Quality before Buying Stocks
5) Weakness in the internal processes and controls of Websol Energy Systems Ltd:
While reading the annual reports of the company, an investor notices numerous aspects that show a weakness in the internal controls and processes of the company.
5.1) Noncompliance with regulatory guidelines:
On multiple occasions, Websol Energy Systems Ltd did not comply with regulatory guidelines. For example, in FY2016, the promoter of the company, Mr S L Agarwal faced the threat of being disqualified as a director when the company did not convert its FCCBs, which matured in Feb. 2012 and were to be converted by Nov. 2012 i.e. had a delay of more than 3 years. The auditor of the company highlighted this issue in its report in the annual report.
FY2016 annual report, pages 7 and 31:
Foreign Currency Convertible Bonds (“FCCBS”) which were to be redeemed or converted into Equity Shares in the Company by November, 2012, but, due to fall in market price of Company’s shares, the same were neither converted nor were redeemed and are still outstanding. Among the then Directors, only Managing Director is still on the Board.
regards to disqualification of director (Mr Sohan Lal Agarwal), we hereby clarify that company has already applied for RBI approval for conversion of the liability of FCCB holder into equity shares of the company
Later, the company got the approval to redeem/convert the FCCBs into equity shares by May 1, 2021.
In FY2022, the company was non-compliant with many regulations, like it did not have the required 6 directors on the board for a part of the year, did not have a Chief Financial Officer (CFO) for a part of the year, did not have a succession plan in place, did not maintain a digital database of certain people as demanded by Securities and Exchange Board of India (SEBI).
FY2022 annual report, page 77:
The Board of Directors of the listed Company (top 2000) did not have 6 directors on the Board from 2nd November, 2021 to 24th March, 2022, during the period under review
Company has not appointed Chief Financial Officer from 2nd November, 2021 to 31st March, 2022 during the period under review.
company has not drawn an orderly succession plan for the appointment to the Board of Directors & Senior Management.
Board of Directors has not ensured that a structured Digital database is maintained comprising of the names of such persons or entities as the case may be with whom information is shared under the SEBI (PIT) Regulations.
Subsequently, in the secretarial audit report released by the company to BSE on May 29, 2023 (click here), the practising company secretary (PCS) made multiple observations about the compliance status of the company, like:
- The company has been advised to upgrade the standards of compliance (page 3)
- BSE issued an email on 11th March 2023 for non-submission of information required under Regulations 46 and 62 of SEBI (LODR) Regulations 2015 on the BSE Listing Centre (page 4)
- Noncompliance with Regulation 32(1) of SEBI(LODR) Regulations, 2015 has been observed. (page 5)
In addition, the auditor also highlighted that both stock exchanges (BSE and NSE) had put a penalty on the company of ₹70,800/- each on the company as it did not have the required minimum 6 directors during the year, which had violated SEBI (LODR) Regulations, 2015 (page 9).
Moreover, after a couple of months, when Websol Energy Systems Ltd released the annual report of FY2023, the secretarial audit report contained in the annual report (pages 80 and 81 of the FY2023 annual report) did not have any of these observations.
An investor may contact the company directly to understand the reasons why the observations about noncompliances, which were a part of the secretarial audit report for FY2023 released by the company on May 29, 2023, to BSE (click here), are not included in the annual report.
5.2) Poor maintenance of fixed assets records and supervision:
The company did not make proper supervision and records of its fixed assets.
FY1999 annual report, page 8:
Fixed Assets records of the Company are incomplete and are being currently updated
Even after 12 years, in FY2011, the fixed assets records of the company were incomplete.
FY2011 annual report, page 44:
Fixed Assets records of the Company are incomplete and are being currently updated
Finally, in FY2012, Websol Energy Systems Ltd reported that its fixed asset records were proper.
FY2012 annual report, page 33:
The company is maintaining proper records showing full particulars, including quantitative details and situation of fixed assets.
However, from the very next year, FY2013, the fixed assets records of the company again became incomplete.
FY2013 annual report, page 23:
Fixed Assets records of the Company are incomplete and are being currently updated
In FY2016, the fixed asset records were still incomplete; however, Websol Energy Systems Ltd appointed an external agency to help in maintaining its records.
FY2016 annual report, pages 7 and 33:
company has appointed a firm of professional accountant to update the pending records of fixed assets with the physical records
In respect of the Company’s fixed assets: (a) The records maintained by the Company are incomplete and currently being updated
However, even after the next 3 years, the records were still incomplete and the auditor highlighted that it could not guarantee whether there were discrepancies in the fixed assets as per records and the actual assets on the ground.
FY2019 annual report, page 45:
physical verification of Fixed Assets is in progress. Therefore, we could not comment on discrepancies, if any between the book records and the physical fixed assets.
In fact, in the FY2019 annual report, the statutory auditor of the company highlighted there are mistakes about the depreciation calculation on fixed assets.
FY2019 annual report, page 64:
Company undertook reconciliation of its fixed assets as per books and as per fixed assets register in 2017-18 and found mistake in calculation of depreciation i.e. the same was found to be overcharged in the books of accounts in earlier years.
Fixed asset records stayed incomplete until FY2020 and then in FY2021, the auditor reported that the fixed assets records are now complete.
FY2021 annual report, page 93:
The Company has maintained proper records showing full particulars including quantitative details and situation of its fixed assets
Considering the continued weakness on the part of the company to maintain records and verification of fixed assets, an investor is concerned to note that the company had repeatedly written off and scrapped its fixed assets citing that they have become obsolete/useless.
An investor thinks that Websol Energy Systems Ltd could have done a better job with the records/monitoring of its fixed assets over the years.
5.3) Lack of a formal internal audit system:
For a significant part of the company’s history, Websol Energy Systems Ltd did not have a formal internal audit system, which is a significant weakness.
FY1997 annual report, page 9:
Company does not have a formal internal audit system.
Until FY2010, the company did not have an internal audit system.
FY2010 annual report, page 52:
The Company does not have a formal internal audit system.
In FY2013, for the first time, the company appointed an external agency to conduct its internal audit.
FY2012 annual report, page 33:
With effect from 1st April 2012 an external entity has been appointed as the Internal Auditor of the company and their first report is yet to be submitted
In addition, there have been numerous instances where the company did not pay its undisputed statutory dues on time indicating either laxness in meeting its obligations or liquidity crunch that it could not generate money even to pay its undisputed statutory dues.
In FY2023, the company used funds from short-term sources for long-term purposes, which usually is one of signs of liquidity stress in the company and may lead to cash flow mismatches in the future.
FY2023 annual report, page 1026:
company has used funds raised on short term basis aggregating to Rs. 200.00 Lakh for long-term purposes.
On multiple occasions, the auditor of the company could not independently verify the amounts due to suppliers, due from customers and the amount of advances from customers shown by the company in its financial statements.
FY2016 annual report, page 30
EMPHASIS OF MATTERS: We draw attention to the matter that the confirmations in respect of balances of Sundry Debtors, Sundry Creditors and Advances from respective parties have not been received in all cases.
FY2017 annual report, page 39:
confirmations in respect of balances of Sundry Debtors, Sundry Creditors and Advances from and to various parties have not been received
FY2018 annual report, page 56:
confirmations in respect of balances of Sundry Debtors, Sundry Creditors and Advances from and to various parties have not been received in all cases.
Also read: Why Management Assessment is the Most Critical Factor in Stock Investing?
5.4) Errors/discrepancies in the data presented in the annual reports of Websol Energy Systems Ltd:
Across many annual reports of Websol Energy Systems Ltd, there are numerous instances where data presented by the company has errors like totalling in tables, repetition of paragraphs, copying & pasting of data from older reports without updating the data for the current year, providing information unrelated/nonrelevant to the particular section etc.
For example, in FY2015 annual report, on page 17, in the section “Remuneration to Managing Director, Whole-time Directors and/or Manager”, the company mentioned that the total remuneration of MD, Mr S L Agarwal is ₹2,206,771.00, whereas if an investor totals the items under 1 (a) 972,000.00 + 1 (c) 972,000.00 + (5) 2,672,771.00, then it comes out to be ₹4,616,771/-

In the FY2023 annual report, while discussing the mitigants to the technology risk faced by the company, instead of detailing how it prevents its technology from becoming obsolete, the company wrote about its internal audit system and how it ensures compliance with regulations.
FY2023 annual report, page 55:
In FY2023, the company’s production was only 12MW, a decline of 94% over FY2022 as it reported sales of ₹17 cr in FY2023 against sales of ₹213 cr in FY2022 and reported a loss of ₹24 cr in FY2023 against a profit of ₹10 cr in FY2022. However, an investor is intrigued when she notices that the company has termed its performance in FY2023 as “impressive.”
FY2023 annual report, page 41:

In the secretarial audit report of Websol Energy Systems Ltd, the auditor has continuously stated from FY2018 to FY2021 that in every year, the company issued ₹47,02,667 equity shares on conversion of FCCBs whereas during those years, the number of shares issued by the company in each year were different.
FY2018 annual report, page 31:
We further report that during the audit period the Company has issued 47,02,667 equity shares in lieu of conversion of FCCB’s
FY2019 annual report, page 17:
We further report that during the audit period the Company has issued 47,02,667 equity shares in lieu of conversion of FCCB’s
FY2020 annual report, page 58:
We further report that during the audit period the Company has issued 47,02,667 equity shares in lieu of conversion of FCCB’s
FY2021 annual report, page 73:
We further report that during the audit period the Company has issued 47,02,667 equity shares in lieu of conversion of FCCB’s
An investor notices that in each of these 4 years (FY2018-FY2021), the secretarial auditor mentioned in its report that Websol Energy Systems Ltd issued 47,02,667 shares by converting FCCBs. While reading the annual reports in detail, the investor found out that only in FY2018, the company issued 47,02,667 shares by converting FCCBs. After that each year, it issued a different number of shares.
For example, in FY2019, it issued 23,51,334 shares by converting FCCBs.
FY2019 annual report, page 45:
The Company had Foreign Currency Convertible Bonds (‘FCCBs’) amounting to US$ 12.00 million, out of which FCCBs of the value US$ 2.14 million has been converted into 23,51,334 Equity Shares of the Company during the year
In FY2020, the company issued 15,67,556 shares by converting FCCBs.
FY2020 annual report, page 65:
The Company had Foreign Currency Convertible Bonds (‘FCCBs’) amounting to US$ 12.00 million, out of which FCCBs of the value US$ 1.43 million has been converted into 15,67,556 Equity Shares of the Company during the year as per the rates approved by regulators and shareholders.
In FY2021, the company issued 5,48,645 shares upon conversion of FCCBs.
FY2021 annual report, page 94:
The Company had Foreign Currency Convertible Bonds (‘FCCBs’) amounting to US$ 12.00 Million, out of which FCCBs of the value US$ 0.50 Million has been converted into 5,48,645 Equity Shares of the Company during the year as per the rates approved by regulators and shareholders
Therefore, an investor is perplexed to see that the secretarial auditor’s report has just copied and pasted data from previously issued reports without verifying the important actual developments regarding the issuance of equity shares. Moreover, it seems that no one at the company could check this error before approving the annual reports for publishing and releasing them in the public domain.
We believe that the company and the secretarial auditor, both, leave room for improvement in their internal controls and processes like maker-checker controls.
Similarly, in the FY2021 annual report, on page 39, the company highlighted that it has deleveraged and that it has a whopping “₹1,271 cr” of long-term debt on its books.

An investor is intrigued to see that in the financial statements for FY2021, Websol Energy Systems Ltd has disclosed a total debt of about ₹35 cr, which is after defaulting and restructuring with lenders who had to sell its properties to recover their money. Also, during these years, the company highlighted that it could not pay its undisputed statutory dues on time because it did not have any banking facilities.
Therefore, it seems that the data of ₹1,271 cr of debt on Websol Energy Systems Ltd in the FY2021 annual report, seems an error, which the company did not rectify before publishing the annual report.
On similar lines, in the FY2023 annual report, the company allotted 21,56,880 shares to Websol Green Projects Private Limited (10,87,880 shares on conversion of its loan) and India Max Investment Fund Limited (1,069,000 shares for fresh investment/cash).
However, the table in which the company disclosed this information contained a heading for some data about disputes of the company related to statutes and the forum where the dispute is still pending.
FY2023 annual report, page 72:
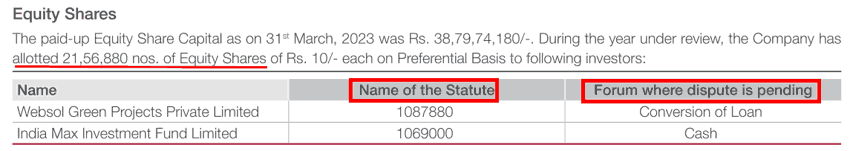
In the above incident also, it seems that the company overlooked the rectification of such errors before publishing the annual report in the public domain.
There are more instances in the annual reports indicating a lack of oversight like in the FY2019 annual report, on page 10, it forgot to write the actual data of net worth, cash balance and debt. Instead, it just mentioned square brackets [ ].
After looking at multiple instances of trivial errors in the presentation of information in the annual reports, an investor is left wondering whether she should be sceptical of the information provided in the company’s annual reports as even the auditors’ reports are found copying and pasting data from old reports without verifying the real developments in the audit period.
5.4.1) Showing interest payment as an outflow under CFO instead of CFF:
In its annual report, from the earliest available annual report of FY1997 to FY2017, Websol Energy System Ltd has included interest paid as an outflow under cash flow from operations (CFO) instead of the usual practice of showing interest payments as an outflow under cash flow from financing activities (CFF).
FY1997 annual report, page 21:
FY2017 annual report, page 46:

From FY2018, the company has shown interest paid as a cash outflow under cash flow from financing activities.
An investor may contact the company directly to understand the reasons why it classified interest payments under cash flow from operations from at least FY1997 to FY2017.
6) Certain business decisions of Websol Energy System Ltd:
An analysis of the annual reports of the company brings the following decisions undertaken by the company to the notice of the investor.
6.1) Very frequent back-to-back multiple changes in the financial year:
Apart from a few changes in its name, the company made frequent changes in the length of its financial year as well.
The company reported FY2010 with a 15-month duration i.e. from April 2009 to June 2010. The very next year, FY2011, the company reported the financial year of 9 months i.e. July 2010 to March 2011. The very next year, FY2012, the company reported results for 15 months i.e. April 2011 to June 2012. Once again in the immediate next year, FY2013, the company reported financials for 9 months i.e. July 2012 to March 2013.
An investor may contact the company directly to understand the reasons for such rapid back-to-back changes in the length of the financial year.
6.2) Large nonoperating/other income reported by the company in FY2017 and FY2021:
In FY2017, Websol Energy System Ltd reported a nonoperating income of about ₹71 cr and in FY2021, the company reported a nonoperating income of ₹60 cr. These amounts are large as they contributed significantly to the net profits of ₹79 cr and ₹49 cr in FY2017 and FY2021 respectively.
In FY2017, the nonoperating income of ₹71 cr constituted primarily the benefit that the company received during the one-time settlement (OTS) with the lenders and with FCCB investors only for their interest portion and forex changes, which it recognized in the profit & loss statement.
FY2017 annual report, page 54:
Income From waiver of Interest and Exch Fluctuation from bank settlment and FCCBs Settlement: ₹7,091.10 lac
So, this gain reported by the company was primarily the loss accepted by the lenders and FCCB investors.
An investor may note that the above-mentioned amount is only related to the interest forgone by lenders and investors. Additionally, the lenders and FCCB investors also faced a big loss on their principal amount of about ₹188 cr, which the company recognized as a benefit directly on its balance sheet.
FY2017 annual report, page 49:

In FY2021, Websol Energy System Ltd reported a nonoperating income of ₹60 cr out of which a major component was ₹69 cr of sundry balances that it wrote back, which were otherwise payable to other parties for trade payables and borrowings. It means that this ₹69 cr was originally to be paid by the company to its various suppliers and lenders; however, now, it no longer has to pay these and therefore, it is reported as an income in the P&L statement.
FY2021 annual report, page 121:
Sundry baalnces written back amounting to Rs 6909.76 includes various credit balance, those were payable to various parties for trade payables and borrowings.
Even in the other years, the company has reported similar nonoperating income by writing back its sundry balances, which otherwise it had to pay to other parties, which ultimately it determined that it is not going to pay.
For example, in FY2013, it wrote back sundry balances of ₹7.38 cr (page 35 of the annual report).
In FY2018 and FY2019, the company again wrote back sundry balances of ₹5 cr and ₹13.75 cr respectively.
FY2019 annual report, page 68:

Therefore, an investor would note that over the years, some of the large contributions to the company’s reported profits are writebacks of interest expenses, sundry balances i.e. the money it had to pay to others etc. and it ended up not paying them.
Also read: Why We cannot always Trust What Management Claims
The Margin of Safety in the Market Price of Websol Energy System Ltd:
Currently (December 18, 2023), Websol Energy System Ltd has made losses of ₹21 cr in the last 12 months (Oct. 2022-Sept. 2023). Therefore, any price-to-earnings (PE) ratio is meaningless for its valuation.
We generally use the PE ratio to find the margin of safety in the purchase price as described by Benjamin Graham in his book The Intelligent Investor.
Moreover, we recommend that an investor read the following articles to assess the PE ratio to be paid for any stock, which takes into account the strength of the business model of the company as well. The strength in the business model of any company is measured by way of its self-sustainable growth rate and the free cash flow generating the ability of the company.
In the absence of any strength in the business model of the company, even a low PE ratio of the company’s stock may be signs of a value trap where instead of being a bargain; the low valuation of the stock price may represent the poor business dynamics of the company.
- 3 Principles to Decide the Ideal P/E Ratio of a Stock for Value Investors
- How to Earn High Returns at Low Risk – Invest in Low P/E Stocks
- Hidden Risk of Investing in High P/E Stocks
Analysis Summary
Overall, Websol Energy System Ltd seems a company that has struggled to keep up with the rapid advances in technology in the solar cell and module manufacturing industry. Due to rapid changes, time and again, its technology kept becoming obsolete forcing it to abandon its existing plant & machinery, scrap it and then invest in expensive new technology.
Such repeated instances of starting with new technology from scratch demanding large investment as well as intense, cut-throat, price-based competition from very large foreign players had almost priced out Websol Energy System Ltd from the market on multiple occasions. The company does not seem to have a
As a result, on many occasions, the company had to completely shut down its manufacturing operations to save on losses. Even now, the company has scrapped its plant that made solar cells from multi-crystalline silicon and is installing a new plant based on new technology, which has led to a complete shutdown of its operations for almost the last 6 quarters.
The company attempted to deal with rapid technological advances and a sharp decline in prices of solar cells and modules by making many changes in its products and processes including raw material sourcing. It tied up with multiple Indian and foreign universities and technocrats; however, it could not avoid losses. Overall, since FY1997, the company had a cumulative loss of about ₹250 cr until FY2023.
Due to weak financial performance, the company has multiple times defaulted to its lenders, in the past, it was reported to BIFR, entered a one-time settlement with lenders and the lenders had to accept losses on their loans, which the company reported as “nonoperative income” and an increase in capital reserves.
The company is highly dependent on govt. regulations and policy decisions for its business, like anti-dumping duty on cheaper imports, incentives to renewable energy, and mandatory domestic content requirements in solar power plants being installed in India. Its business was impacted when US-China had a trade war and Chinese companies flooded global markets with their excess production. It was affected when the US and India had a trade war and the USA took India to the World Trade Organization against Indian domestic content policy.
Websol Energy System Ltd tried to become a subcontractor to Chinese solar equipment manufacturers by making modules in their name to keep its business running. It even attempted to enter into the retail business by alliance with Exide. It attempted to enter into the EPC business multiple times. It even started solar cell manufacturing as well as a silicon wafer-making facility in Singapore. However, most of these initiatives failed and it could not create a strong business model.
The company has suffered on account of the capital-intensive business of solar equipment manufacturing. Its business could never generate sufficient funds to meet its operating and growth requirements. Its inventory management and receivables collection efficiency left scope for improvement as it faced inventory and receivables write-offs. Due to the continuous need for capital infusion, it had to raise money repeatedly by equity dilution via FCCBs, GDR, warrants, preferential allotment, and unsecured loans from promoters that were converted into shares.
Until now, the promoter, Mr S L Agarwal, aged 77 years, was running the company. Now, his granddaughter, aged 26 years, has joined the company. It remains to be seen whether she can turn around the company.
In the past, there were occasions when the promoter took home a higher remuneration despite the declining performance of the company. Investors should monitor the remuneration of promoters going ahead. The company has given a comfort letter to LICHFL on behalf of promoters and in the past, one related party did not pay the loan given by the company and the company had to seek legal course to recover its money. An investor should keep track of related party transactions of the company with its promoters.
The company had shown numerous instances of weakness in internal processes and controls like noncompliance with regulatory guidelines, maintenance of records of fixed assets, internal audit function, delays in payment of undisputed statutory dues, errors in the data presented in annual reports etc. An investor should double-check the data before relying on it for analysis.
Going ahead, an investor should closely monitor the progress of its ongoing plant installation, its JV with AMP, and policy measures in the solar power industry.
Further advised reading: How to Monitor Stocks in your Portfolio
These are our views on Websol Energy System Ltd. However, investors should do their own analysis before making any investment-related decisions about the company.
You may use the following steps to analyse the company: “Selecting Top Stocks to Buy – A Step by Step Process of Finding Multibagger Stocks”
I hope it helps!
Regards,
Dr Vijay Malik
P.S.
- Subscribe to Dr Vijay Malik’s Recommended Stocks: Click here
- Chennai “Peaceful Investing” Workshop | 26 July 2026: Register Here
- To learn stock investing through videos, you may subscribe to the Peaceful Investing – Workshop Videos
- 25% savings on buying our Stock Analysis Excel Template and all ebooks together: Analysis Package: Excel Template + All eBooks (25% savings)
- To download our customized Stock Analysis Excel Template for analysing companies: Stock Analysis Excel
- Learn about our stock analysis approach in the e-book: “Peaceful Investing – A Simple Guide to Hassle-free Stock Investing”
- To learn how to do business analysis of companies: e-book: Business Analysis Guide
- To pre-register/express interest in a “Peaceful Investing” workshop in your city: Click here
Disclaimer
I, Vijay Malik, am a SEBI-registered Research Analyst (Regn. No. INH100008364). This article is for educational purposes only and does not constitute investment advice or a recommendation to buy or sell any securities. Investors should do their own research before making any investment decisions.
I, or my immediate relatives, do not have any financial interest in the companies discussed as on the date of publication of this article, nor do we hold one per cent or more of the securities of such companies at the end of the month immediately preceding it. I do not have any material conflict of interest and have not received any compensation or other benefits from the companies or any third party in relation to this article during the 12 months preceding its publication. I have not served as an officer, director, or employee of the subject companies, nor have I been engaged in market making activity for them.

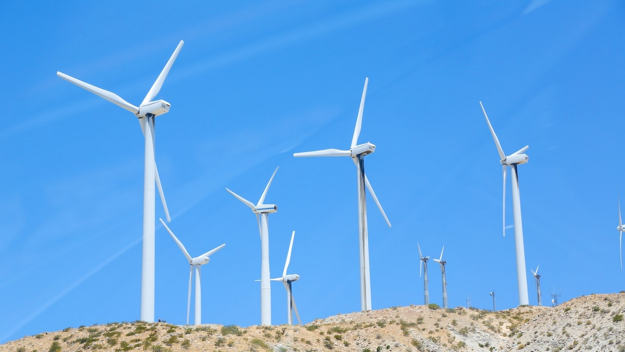


2 thoughts on “Analysis: Websol Energy System Ltd”
Hello Sir,
Thanks for sharing your valuable knowledge.
I am a non-finance guy so I have a doubt about one of your company analyses, of Sreeleathers Ltd.
According to your analysis, the NFAT ratio of the company is 0.89 and according to your article on NFAT, a ratio less than 1.5 or something is a very capital-intensive business.
However company’s inventory turnover ratio is 10-11 and it is working with very low manpower. The company outsources products and sells them. It only did a capital expenditure of ₹1 cr in 10 years during (2011-2020).
So, according to this data, it is an asset-light business model but the NFAT ratio doesn’t show this.
Please give your thoughts on this and correct me if I am wrong.
Dear Sourav,
Thanks for writing to us!
To understand NFAT for Sreeleathers Ltd, we request you to follow the below steps:
1) Check the formula of NFAT from the following article: Asset Turnover Ratio: A Complete Guide for Investors
2) Take values of the inputs required to calculate NFAT, from the annual report of Sreeleathers Ltd and calculate NFAT.
3) If NFAT is low, then check what is leading to it: whether it is the low value of the numerator or the high value of the denominator.
4) Based on the observation, try to find out why the numerator is low or why the denominator is high.
We request you to follow the above steps and attempt to find the answer to your query on your own and share your learning from this exercise.
We shall be happy to provide our inputs to your line of thought after the above exercise.
Regards,
Dr Vijay Malik