The current section of the “Analysis” series covers Accelya Solutions India Ltd, a leading software and outsourcing solutions provider for the airline and travel industry. The company is owned by a private equity firm, Vista Equity Partners.
The “Analysis” series is an attempt to share with all the readers, our inputs to the company analysis submitted by readers on the “Ask Your Queries” section of our website.
Please note that to benefit the maximum from this article; an investor should focus on the process of analysis instead of looking for good or bad aspects of the company. She should learn the interpretation of different types of data and transactions and pay attention to the parts of annual reports etc. used to get the information. This will help her in improving her stock analysis skills.
Accelya Solutions India Ltd: Detailed Fundamental Analysis
On different occasions in the past, Accelya Solutions India Ltd has created child entities (subsidiaries, joint ventures etc.). As a result, since FY2002, it has published standalone as well as consolidated financials.
On Dec 31, 2022, the company had two subsidiary companies; Accelya Solutions UK Limited and Accelya Solutions Americas Inc. (Dec. 2022 quarter results, page 11).
We believe that while analysing any company, an investor should always look at the company as a whole and focus on financials, which represent the business picture of the entire company including its subsidiaries, joint ventures etc. Consolidated financials of a company present such a picture. Therefore, if a company reports both standalone as well as consolidated financials, then in such a case, it is advised that the investor should prefer the analysis of the consolidated financials of the company, whenever they are present.
Therefore, while analysing the past financial performance of Accelya Solutions India Ltd, we have analysed the consolidated financials of the company.
Further advised reading: Standalone vs Consolidated Financials: A Complete Guide
An investor should also note that over the years, the company has witnessed multiple changes in names as well as promoters.
- In 1986, the company was promoted by Mr Narendra Kale and Mr Vipul Jain as Kale Consultants Ltd.
- In FY2011, Chequers Capital bought the company from Mr Kale and Mr Jain using Accelya group and renamed it Accelya Kale Solutions Limited.
- In FY2017, Warburg Pincus bought the company from Chequers Capital and the company was renamed Accelya Solutions India Limited.
- In FY2020, Vista Equity Partners bought the company from Warburg Pincus.
With this background, let us analyse the financial performance of Accelya Solutions India Ltd.
Financial and Business Analysis of Accelya Solutions India Ltd:
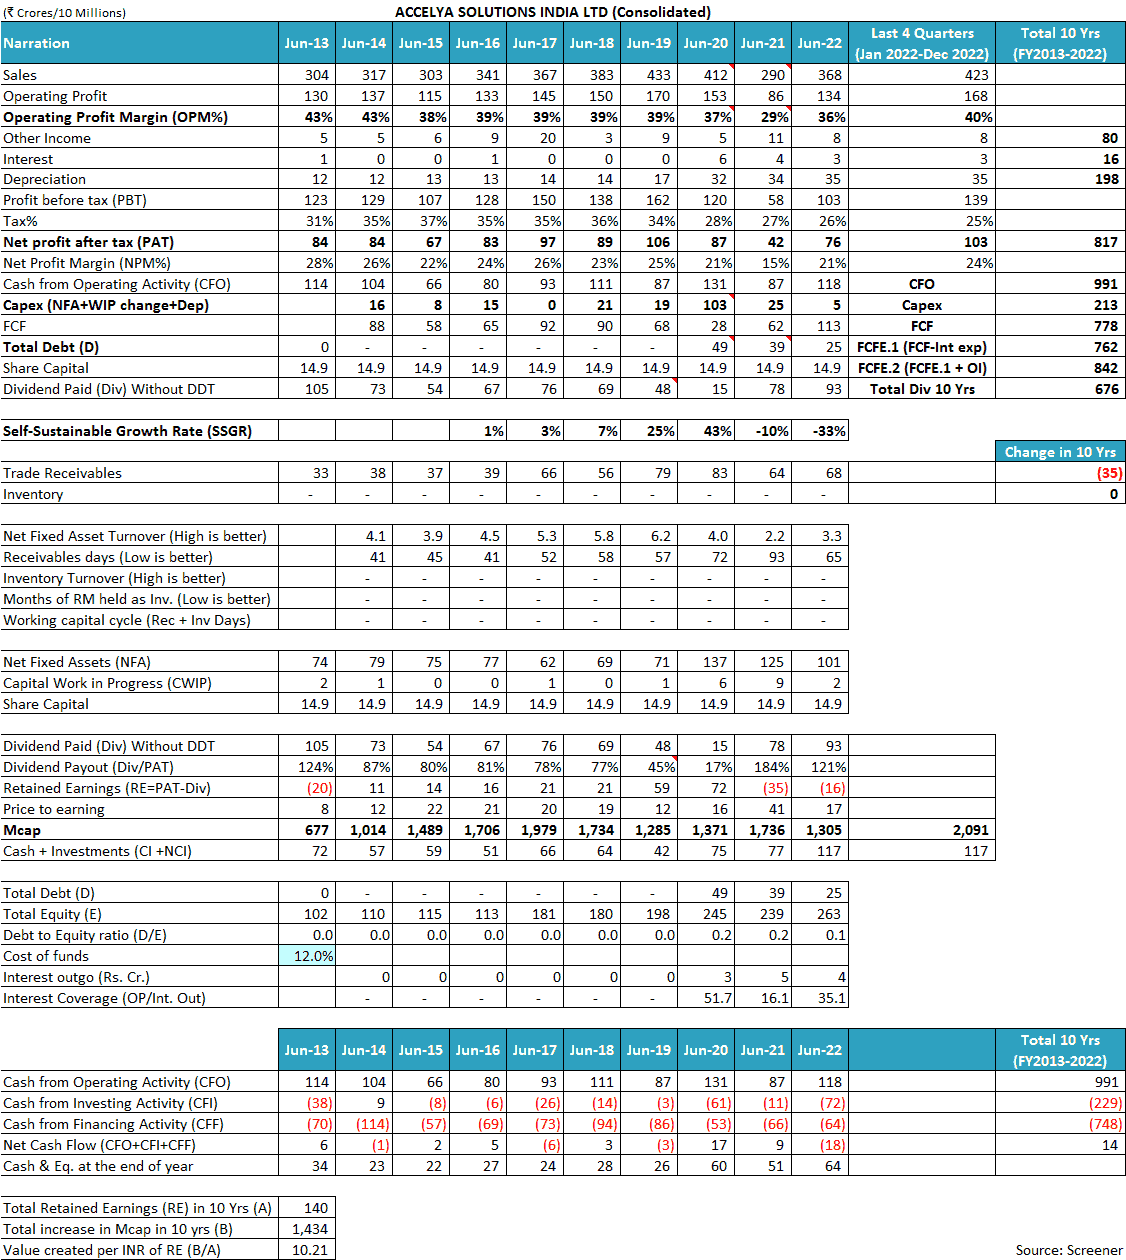
In the last 10 years (FY2013-FY2022), the sales of Accelya Solutions India Ltd have increased at 2% year on year, from ₹304 cr in FY2013 to ₹368 cr in FY2022. In the last 12 months ending Dec. 2022 (i.e. Jan. 2022 to Dec. 2022), the company reported sales of ₹423 cr. At times, the company saw its sales decline like in FY2015, FY2020 and FY2021.
Over the years, the operating profit margin (OPM) of Accelya Solutions India Ltd has been around 38%-40%, which declined during FY2020 and FY2021 to 29%. However, the OPM has again recovered to 40% in the last 12 months ending Dec. 2022 (i.e. Jan. 2022 to Dec. 2022).
On an overall basis, during FY2013-FY2022, the profit after tax (PAT) of the company declined from ₹84 cr in FY2013 to ₹76 cr in FY2022.
To understand the reasons for such a financial performance of Accelya Solutions India Ltd, an investor needs to read the publicly available documents of the company like its annual reports from FY1999 onwards, credit rating reports by ICRA, corporate announcements as well as other public documents.
In addition, an investor should also read the following article explaining the key factors affecting the business of information technology companies: How to do Business Analysis of IT Services Companies
The above-mentioned documents indicate that the following key factors influence the business of Accelya Solutions India Ltd, which are critical to understand for any investor analysing the company.
1) Low growth prospects of the business:
While analysing the financial performance of Accelya Solutions India Ltd, one thing that stands out is its low business growth rate over the last 10 years (FY2013-FY2022). There are multiple reasons for the low growth prospects of the company’s business.
First and foremost, the market that Accelya Solutions India Ltd can cater to, is small. Therefore, even after the best of its efforts, the company cannot grow a lot.
Credit rating report by ICRA, May 2018, page 3:
The company’s scale of operations remains modest owing to limited market for outsourcing in the airlines services space, thereby limiting its growth prospects.
1.1) Intense competition for airline services business:
Even within this small market opportunity, Accelya Solutions India Ltd faces intense competition from other information technology services as well as from in-house technical teams of airlines.
FY2013 annual report, page 2:
Airline business is very complex and competition from other service providers is intense.
Credit rating report by ICRA, May 2018, page 3:
Kale also faces stiff competition from other third-party outsourcing companies and also from the in-house departments of airlines.
The role of in-house technical teams of airlines in the industry is significant because as per the company, they form the second largest player in the market after it. Accelya Solutions India Ltd own 20% of the market. (Source: Accelya leads with 20% NDC market share, who is number two?)
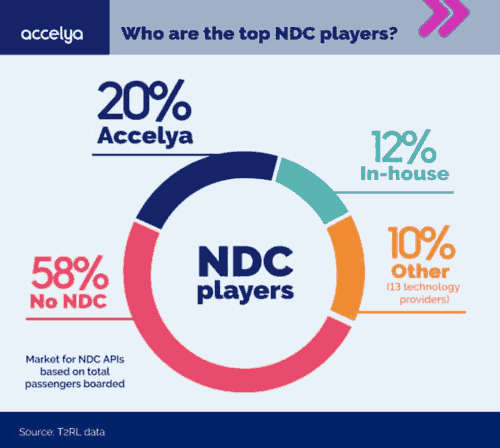
Technical divisions of airlines own 12% of the market and provide tough competition to the players like Accelya Solutions India Ltd. For example, the technical division of Lufthansa airlines, Lufthansa Systems Airline Consulting is offering its solutions for new distribution capabilities (NDC) and ONE Order standard to other airlines.
Airlines have been active players in the market of airline services for a long period. For example, in the past, British Airways had a significant presence in the market via its technical division, Speedwing. It developed many products that it offered to other airlines. However, in the dot-com bubble, British Airways sold off many products of Speedwing, which were bought by Accelya Solutions India Ltd in FY2001.
FY2001 annual report, page 8:
Your Company acquired four software products from Speedwing, a division of British Airways Pic. UK, in July, 2000.
Due to a small market and intense competition, Accelya Solutions India Ltd has a limited ability to grow its business.
The limited opportunity for growth seems to be the primary reason that so many different promoters have sold off the company in quick succession in the last decade.
In FY2011, the founder-promoters, Mr Kale and Mr Jain sold off their entire shareholding to Chequers Capital (Accelya) when the company had achieved a revenue of ₹226 cr. From FY2011, until FY2022, the company has grown its sales at a rate of 5%.
In FY2011 when the promoters sold their entire stake and the promoter Mr Vipul Jain became an employee-managing director of the company, it seemed similar to Kokuyo Camlin Ltd where the promoters of Indian company sold a majority stake to Kokuyo, Japan and became employees of the company i.e. the promoters preferred paycheque to the dividends.
An investor may read our analysis of Kokuyo Camlin Ltd in the following article: Analysis: Kokuyo Camlin Ltd
In fact, in FY2011 when Chequers Capital took over the company, the remuneration of Mr Vipul Jain increased sharply by more than 80% from about ₹1.5 cr in FY2010 to ₹2.7 cr in FY2011. This sharp increase in remuneration of Mr Vipul Jain was despite a decline of more than 20% in the net profit of the company in FY2011 to about ₹20 cr from ₹26 cr in FY2010.

Due to the lack of growth opportunities, Accelya Solutions India Ltd has been paying out large dividend payouts to its investors because it is not finding opportunities to gainfully deploy its capital. At times, the dividend payout of the company has exceeded 100% of its net profits indicating that the company has paid out the entire profits of the year and in addition, has used the existing cash balance to pay dividends to its shareholders.
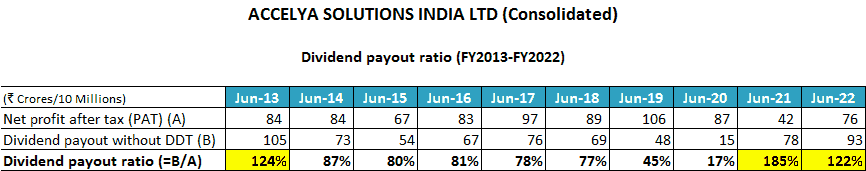
The company also acknowledged it when it declared dividends more than its profits in FY2013. The company stated that the high dividend reflected its current year’s performance as well as its past performance.
FY2013 annual report, page 2:
A dividend payout of Rs. 70 per share (which includes Rs. 40 per share proposed) reflects not only current year’s performance, but past performance as well as our ability to generate free cash on an on-going basis.
The manner in which, the company has changed hands among private equity players; from Chequers Capital to Warburg Pincus and then to Vista Equity Partners, it seems that every time a new buyer came with hopes of generating high growth. However, soon, it realized that in this business swift growth is not possible. Therefore, every time, soon after purchase, the buyer of the company became a seller.
2) Per-transaction billing model:
Originally, Accelya Solutions India Ltd primarily focused on creating software products serving airlines and then selling their licenses to airlines based on a one-time license fee. The products of the company were good and they found well-known customers. However, a one-time sale model did not generate any recurrent income. It led to a continuous search for new customers, year-on-year, for growing its revenue.
FY2005 annual report, pages 23-24:
the classical Initial Licensing Fee (ILF) model, where an upfront license fee was collected from a customer and subsequent years would see relatively small AMC incomes from the same customer. It meant that one looked for new sales every year just to replace revenues. The challenges in doing this whilst selling large enterprise-wide applications to an industry with a very finite customer set can well be imagined.
Nevertheless, when Accelya Solutions India Ltd started its outsourcing business (Managed Process Solutions, MPS), then it focused on per-transaction billing instead of per-seat (number of people employed) billing. As a result, when its customer airlines flew more passengers (i.e. higher number of transactions), then Accelya Solutions India Ltd made more money.
FY2003 annual report, page 5:
While the MPS business has grown significantly on a YOY basis, the headcount has increased only by 58% from 92 to 145, which has led to improved margins. Kale’s business model is not based on a per seat pricing, but on a per-transaction cost and thus the productivity benefits are to Kale’s benefit.
Accelya Solutions India Ltd liked the per-transaction business arrangement so much that for its software sales business as well, it focused on turning it into a per-transaction-based, multi-year contracted business instead of a one-time license sale business.
FY2005 annual report, page 24:
Here Kale provides the application and infrastructure and customer uses the system. Charges are per transaction for product, hardware, system software and system management services. Typical contracts would be for 4-5 years in duration….These revenue models lead to long term, periodic, annuity type revenue.
By FY2006, the company earned almost 70% of its revenue from sustainable annuity-type contracts.
FY2006 annual report, page 29:
During the year ended 31st March, 2006 over 70% of the revenues of the company are such annuity type predictable revenue
Due to per-transaction billing, the business of Accelya Solutions India Ltd became highly dependent on the air-traffic growth i.e. the number of passengers flown by airlines.
Airlines business is very sensitive to any economic or political turmoil. This is because in political or security-related issues people do not feel very safe travelling by air whereas during economic downturns, both companies as well as individuals cut down on air travel to save on expenses.
As a result, whenever there is a downturn, the airline industry is impacted, which in turn affects Accelya Solutions India Ltd due to a lesser number of transactions.
FY2013 annual report, page 15:
The airline industry is amongst the first to be impacted by any major economic or political situations.
After switching its business model to a per-transaction basis, Accelya Solutions India Ltd faced the first such situation in FY2009 when due to a financial meltdown, people and companies reduced spending on air travel. Because of the reduction in the number of passenger transactions, the business of Accelya Solutions India Ltd was affected.
FY2009 annual report, page 2:
The immediate impact is lower revenues from our existing customers because many of our contracts have a transaction (E.g. per passenger or per air waybill model) based pricing. Thus if there are fewer passengers flying compared to a year ago or less cargo being carried, we earn less on the same contracts.
In recent times, the business of Accelya Solutions India Ltd was severely impacted in FY2020 and FY2021 when due to coronavirus pandemic-related lockdowns, air travel reduced significantly. As lesser passengers flew in aircraft, the business of Accelya Solutions India Ltd, which earns on a per-transaction basis, was affected significantly.
Over two years of FY2019-FY2021, the revenues of the company declined by about 33% and its operating profit margin declined from 39% in FY2019 to 29% in FY2021.
FY2021 annual report, page 4:
Company’s business model is principally based on per transaction pricing, the Company’s revenue which is linked to airline passenger transactions suffered from larger impact due to minimum billing agreements with customers.
Credit rating report by ICRA, July 2021, page 1:
revenue in 9M FY2021 recording degrowth of 41.4% YoY. The revenue was impacted because of significant decline in airline passenger traffic amid the pandemic.
Therefore, even though it may seem that due to per-transaction billing, Accelya Solutions India Ltd has created a significant operating leverage in its business i.e. as airlines carry a higher number of passengers, the company makes more money without a significant additional investment.
However, an investor should also note that the business of Accelya Solutions India Ltd is very vulnerable to any economic and political situation because air travel is one of the first sectors to feel the impact of such circumstances.
Advised reading: How to do Business Analysis of Steel Companies
3) Declining focus of Accelya Solutions India Ltd on research & development:
Over the years, the focus of the company on research and development (R&D) has gone down. It is clearly visible from the money spent by the company on R&D as a percentage of sales.
The following table shows the R&D expenditure done by Accelya Solutions India Ltd as a percentage of its sales over the last 20 years (FY2003-FY2022).

When the founder promoters (Mr Kale and Mr Jain) were running the company, then they had a high focus on R&D as they were spending almost 7%-10% of revenue on R&D. However, ever since the private equity players (Chequers Capital, Warburg Pincus and Vista Equity Partners) took over the company, the R&D expenditure has declined significantly to less than 1% of sales.
Accelya Solutions India Ltd, in FY2003, when it was under its founder-promoters and had only ₹55 cr of revenue spent ₹5.6 cr (10% of sales) on R&D. Whereas, in FY2022, when the company is under private equity players and has sales of ₹368 cr, then it has spent only ₹3.8 cr (1% of sales) on R&D.
It looks like the private equity players have focused more on taking out high dividend payouts to give cash payments to their investors (limited partners) instead of spending it on R&D to develop new products, which can take the company to the next level.
Even the credit rating agencies have highlighted the focus of private-equity promoters on large dividend payments as a constraint on the business strength of the company.
Credit rating report by ICRA, May 2018, page 2:
The company has maintained a liberal dividend policy since it was taken over by Accelya in FY2012, which has constrained the accretions to net worth and accumulation of liquid reserves
Focus on removing the money from the company limits its ability to expand its business, develop new products, and enter new industries for growth. Instead, now, the company has to restrict its business to the modest growth opportunities provided by the airline industry only.
Advised reading: Credit Rating Reports: A Complete Guide for Stock Investors
4) Declining number of employees of Accelya Solutions India Ltd:
When an investor looks at the number of people employed by the company over the last 20 years (FY2003-FY2022), then she makes some key findings.
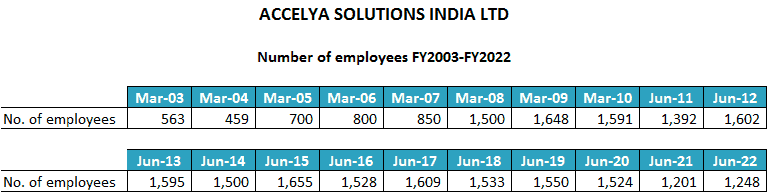
The number of employees of Accelya Solutions India Ltd was growing at a sharp pace until the company was managed by founder promoters (Mr Kale and Mr Jain). Under their control, the number of employees increased from 563 in FY2003 to 1,591 at the end of FY2010.
In FY2011, Chequers Capital took control of the company and soon thereafter, the growth in the number of employees stagnated. In FY2022, Accelya Solutions India Ltd had 1,248 employees, which is less than the number of employees it had in FY2008, about 15 years back.
5) A sharp contrast in the business strategy of founder-promoters and private equity owners:
It looks as if the private equity (PE) owners are not willing to invest in the business of the company by way of R&D or increasing the workforce. Instead, the PE players are more interested in taking out the annual cash generated by the company by way of high dividend payouts.
This is in sharp contrast to the business strategy of expansion followed by the founder-promoters (Mr Kale and Mr Jain) who focused on expanding to newer markets and business opportunities by investing a large proportion of its sales in R&D and increasing the employee count at a fast pace.
The founder-promoters worked hard to expand the business into newer geographies, which consumed a lot of cash. As a result, the promoters felt that the business is not able to generate sufficient cash.
FY2005 annual report, page 3:
While Kale grew and earned a great reputation, we did not generate adequate funds to sustain the heavy investments required to break into the global market.
As a result, time and again, the company had to rely on raising funds through debt, equity dilution and selling assets to capitalize on growth opportunities.
- In FY2000, the company raised ₹38.25 cr via an initial public offer (IPO) to meet its funds’ requirements. (FY2000 annual report, page 10).
- In FY2004, the company raised ₹3.1 cr from promoters by issuing shares and warrants to promoters on a preferential basis (FY2004 annual report, page 10).
- In FY2010, the company raised ₹4.8 cr from the promoters by issuing warrants.
The company also resorted to raising debt to fund its acquisitions.
FY2005 annual report, pages 25-26:
Interest and Finance Charges increased from Rs. 4.29 million in 2003-04 to Rs. 8.67 million, primarily due to loans taken to fund the acquisition of Cognosys
In FY2008, the company sold one of its properties to fund its acquisition of a company in the UK (Zero Octa).
FY2008 annual report, pages 7 and 19:
Profit After Tax includes an exceptional item of Rs.101.16 million which is primarily a net of profit on sale of property of Rs.127.51 million
During the year Kale made an investment in a wholly owned subsidiary viz. Kale Revenue Assurance Services Limited, UK of Rs.123.41 million for the purpose of acquisition of Zero Octa UK Limited.
The promoters found all the avenues to generate cash like giving out spare space in the office building on rent to generate additional cash. In FY2006, the company earned a rent of ₹3.36 million (FY2006 annual report, page 26) and in FY2007, it earned a rent of ₹5.13 million (FY2007 annual report, page 29).
The founder-promoters expanded to newer geographies and formed subsidiaries and joint ventures. Sometimes, they succeeded and sometimes, they failed.
The company ventured into New Zealand; but had to shut down the subsidiary when the business did not make any sense.
FY2004 annual report, page 10:
Your Company also closed down its wholly owned subsidiary in New Zealand viz. Kale Consultants NZ Limited. In the changed market scenario, the market was not attractive enough for the subsidiary to continue its presence in the region
Founders established entities in Australia and Malaysia. However, they had to take a loss when the businesses did not work out as expected.
FY2005 annual report, page 7:
your Company has assessed a decline, other than temporary…in a subsidiary viz. Kale Consultants Australia Pty. Limited and a joint venture viz. Antah Kale Sdn. Bhd. As a result of this assessment, a provision has been made for diminution in the value of investments of Rs. 25.19 million and Rs. 4 million respectively
Therefore, the desire to take risks as well as the business growth strategy of the company has undergone a big change since the private equity players have taken over the company.
Advised reading: How to study Annual Report of a Company
6) Narrowing down business focus to only airlines & travel industry:
Originally, apart from airlines, Accelya Solutions India Ltd served multiple other industries like hospitals, banking etc. and it was a prominent player serving those industries.
For example, in the late 1990s, it was India’s largest provider of hospital-management software solutions. It had about 70% market share and had many renowned Indian as well as international hospitals as customers.
FY1999 annual report, page 7:
the company is India’s largest hospital management solution provider with over 70% market share.
KCL’s clients in this segment include prestigious hospitals like Breach Candy Hospital and Research Centre, Bombay Hospital, Tata Main Hospital, Jehangir Nursing Home, The Aga Khan Hospital (Tanzania), City Medical Centre (Malaysia), etc.
Similarly, it catered to the banking industry and had almost 35 banks as its customers including leading public sector, private as well as international banks.
FY1999 annual report, page 6:
KCL has bagged several clients in this sector, including Citibank, Punjab National Bank, Central Bank of India, Bank of Maharashtra, Bank of Baroda, The United Western Bank Ltd, etc.
However, later on, to focus solely on the airline industry, it sold off all these businesses.
In FY2004, Accelya Solutions India Ltd sold its banking business to Onward Technology Ltd and its Citibank business to Polaris Software. It sold off its healthcare business to Sobha Renaissance Information Technology Pvt. Ltd.
FY2004 annual report, pages 8 and 9:
This involved transfer of the software services business with Citibank / Orbitech to Polaris Software Labs Limited, sale of the Banking Products division to Onward Technologies Limited
your Company has transferred its Healthcare business under the brand name WINCARE™ to Sobha Renaissance Information Technology Private Limited.
As a result, it became very narrowly focused on airlines and the travel industry.
FY2004 annual report, page 8:
With this restructuring, your Company has become a pure play in the Airlines and Travel industry.
Because of a very narrowed-down focus on an industry with limited players where existing airlines also focus on developing technological solutions in-house and selling them to other airlines, Accelya Solutions India Ltd has limited its growth prospects.
As a result, it seems that the founder-promoters sold it and moved on and whenever anyone else buys it, very soon, it starts looking to sell it off.
7) Customer concentration risk of Accelya Solutions India Ltd:
The airline industry is highly vulnerable to events and downturns and has very few customers running their operations profitably. Moreover, year-on-year, the profit margins of airline companies are deteriorating.
FY2019 annual report, page 42:
The airline industry will see lower margins owing to factors such as labor, fuel and infrastructure. Deteriorating business environment with trade wars will add more pressure on the margins
As per the company, in 2016, airlines were expected to make a profit of $10.4 per passenger (FY2016 annual report, page 35) whereas the same had declined to $6.12 in FY2019 (FY2019 annual report, page 42).
Therefore, Accelya Solutions India Ltd, which focuses sharply on the airline industry faces customer concentration risk as well as weak negotiating power against its large customers.
FY2022 annual report, page 185:
One of the customers accounted for more than 10% of the revenue for the year ended 30 June 2021.
The loss of any such large customers affects its business growth.
Credit rating report by ICRA, May 2018, page 1:
Dependence upon a few customers has impacted the company’s growth trajectory when it witnessed a few customer exits in the past. In the last fiscal too, the loss of a key customer in Q2 FY2018, as it filed for bankruptcy, impacted its growth in Q3 FY2018.
As discussed earlier, there are only limited outsourcing opportunities in the airline industry. Therefore, a change in the business strategy of even one customer has affected the business of Accelya Solutions India Ltd.
FY2014 annual report, page 13:
Accelya Kale had a challenging year because the year started with the loss of a significant sized contract with one of its key customers. This was largely due to change in the customer’s IT and outsourcing strategy
At times, large customers have forced tough terms on the company like longer credit periods than the industry norms.
Credit rating report by ICRA, May 2018, page 1:
The strengths are partially offset by the concentration of revenues on a few customers and in a single vertical (airlines), modest scale of operations, its liberal dividend policy and a slightly elongated payment cycle for one of its customers.
Therefore, while projecting the performance of Accelya Solutions India Ltd in the future, an investor should keep in her mind the limited growth opportunities provided by the airline industry and the high negotiating power of a few large profitable airline players. She should also note the preference of its promoters (PE players) to take large dividends from the company instead of investing the money to venture into newer products and industries for growth.
Over the last 10 years (FY2013-FY2022), the tax payout ratio of Accelya Solutions India Ltd is in line with the corporate tax rate prevalent in India. The decline in the tax payout ratio in the recent year is due to a reduction in the corporate tax rate announced by India in FY2020.
Advised reading: How to do Financial Analysis of a Company
Operating Efficiency Analysis of Accelya Solutions India Ltd:
a) Net fixed asset turnover (NFAT) of Accelya Solutions India Ltd:
Over the years, the NFAT of the company had increased from 3.9 in FY2015 to 6.2 in FY2019. The main reason for this improvement in the NFAT seems to be the hesitation by the company to invest more in the physical infrastructure as it restricted its employee count growth. As there was no new large investment in the physical infrastructure, the NFAT of the company kept on increasing due to the declining denominator due to depreciation.
In FY2020, the company invested in new office premises in Mumbai, which led to a decline in the NFAT. Thereafter, the decline in the business performance of the company due to the coronavirus pandemic has led to a decline in the NFAT. As a result, from FY2019 to FY2022, the NFAT of the company declined from 6.2 to 3.3.
Nevertheless, unlike manufacturing companies, the business of information technology (IT) companies is not highly dependent on investment in physical infrastructure. Therefore, NFAT as a parameter may not provide very useful insights into the operating efficiency of IT companies.
Further advised reading: Asset Turnover Ratio: A Complete Guide for Investors
b) Inventory turnover ratio (ITR) of Accelya Solutions India Ltd:
The company operates in the information technology/software segment and does not require any physical inventory for running its business.
FY2011 annual report, page 24:
company is a service company, primarily rendering IT and IT enabled services. Accordingly, it does not hold any physical inventories.
Therefore, the inventory turnover ratio is not a very useful parameter for assessing the company.
Further advised reading: Inventory Turnover Ratio: A Complete Guide
c) Analysis of receivables days of Accelya Solutions India Ltd:
Over the years, the receivables days of Accelya Solutions India Ltd have deteriorated from 41 days in FY2014 to 93 days in FY2021. Even though the receivables days of the company have improved to 63 days in FY2022; however, still, the overall trend of declining receivables days indicates that the company is losing its negotiating power over its customers to collect its dues on time.
One of the reasons is the large-sized customers of the company in a highly volatile and vulnerable industry who hold a high negotiating power over Accelya Solutions India Ltd. As mentioned earlier, the company faces customer concentration risk where the largest customer of the company has negotiated for a longer credit period.
In addition, during the coronavirus pandemic, the troubles faced by the airline industry deteriorated the financial health of all the airlines, which delayed payments to their suppliers like Accelya Solutions India Ltd.
Credit rating report by ICRA, July 2020, page 2:
In the current environment, the company’s receivables are expected to remain stretched, given the stress on its clients.
As a result, during FY2020-FY2021, the receivables days of Accelya Solutions India Ltd increased sharply from 52 days in FY2019 to 93 days in FY2020.
This period resulted in large receivables write-offs by the company.
- In FY2022, the company wrote off ₹4 cr of receivables (FY2022 annual report, page 176).
- In FY2020, it wrote off ₹3 cr of receivables (FY2020 annual report, page 176).
These write-offs were especially large when compared to regular receivables write-offs of about ₹1 cr every year by the company in previous years.
At any point in time, the company used to have about ₹10 cr – ₹20 cr of unbilled receivables, which used to stay unbilled for about 30-90 days. Unbilled receivables represent money for that work, which the company has done for the customer but not billed for it i.e. not yet asked the customer to pay for it.
FY2020 annual report, page 186:
Unbilled receivables is ₹ 119,056,651 and ₹ 96,705,245 as at 30 June 2020 and 30 June 2019 respectively. The Company’s unbilled receivables generally ranges from 30 – 90 days.
In FY2020, the company had to write off about ₹4.5 cr of unbilled receivables (FY2020 annual report, page 148).
In addition, in FY2022, the company wrote off the accrued income of about ₹2 cr, which it had already worked for but had not received from the customers (FY2022 annual report, page 176).
The stress in the airline industry was so much that Accelya Solutions India Ltd had to write off even the withholding tax deducted by its counterparties because it seems that the counterparties were no longer in a position to deposit these taxes.
In FY2021, the company wrote off a withholding tax of ₹4.8 cr and in FY2022, it wrote off the withholding tax of ₹2.9 cr (FY2022 annual report, page 176).
The period of the coronavirus pandemic (FY2020-FY2022) is not the only period when Accelya Solutions India Ltd faced delays in the collection of its receivables and subsequent write-offs.
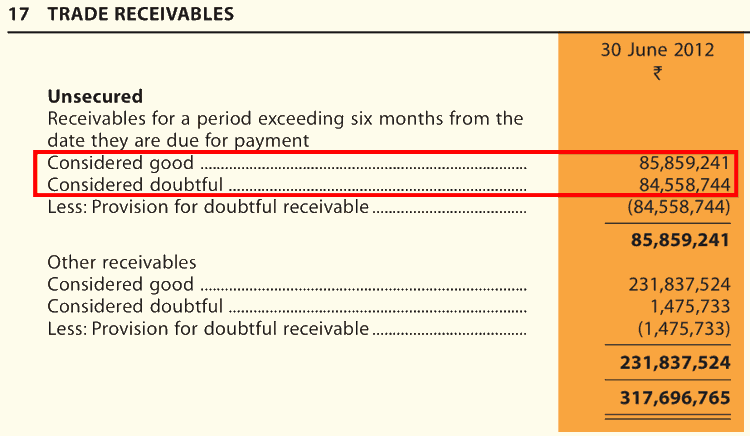
Previously, in FY2012 also the company faced similar circumstances when almost 17 cr out of total receivables of ₹40 cr were overdue for more than 6 months. Out of these, the company had provided for about ₹8.5 cr of receivables as doubtful for collection.
Going ahead, an investor should monitor the trend of receivables days as well as unbilled receivables of Accelya Solutions India Ltd to assess whether it is able to collect its receivables on time.
Further advised reading: Receivable Days: A Complete Guide
When an investor compares the cumulative net profit after tax (cPAT) and cumulative cash flow from operations (cCFO) of Accelya Solutions India Ltd for FY2013-2022, then she notices that over the years (FY2013-FY2022), the company has not converted its profit into cash flow from operations.
Over FY2013-22, Accelya Solutions India Ltd reported a total net profit after tax (cPAT) of ₹817 cr. During the same period, it reported cumulative cash flow from operations (cCFO) of ₹991 cr.
It is advised that investors should read the article on CFO calculation, which would help them understand the situations in which companies tend to have the CFO lower than their PAT. In addition, the investors would also understand the situations when the companies would have their CFO higher than PAT.
Further advised reading: Understanding Cash Flow from Operations (CFO)
Learning from the article on CFO will indicate to an investor that the cCFO of Accelya Solutions India Ltd is higher than the cPAT due to the following reasons:
- Depreciation expense of ₹198 cr (a non-cash expense) over FY2013-FY2022, which is deducted while calculating PAT but is added back while calculating CFO.
- Interest expense of ₹16 cr (a non-operating expense) over FY2013-FY2022, which is deducted while calculating PAT but is added back while calculating CFO.
Going ahead, an investor should keep a close watch on the working capital position of Accelya Solutions India Ltd.
The Margin of Safety in the Business of Accelya Solutions India Ltd:
a) Self-Sustainable Growth Rate (SSGR):
Read: Self Sustainable Growth Rate: a measure of Inherent Growth Potential of a Company
Upon reading the SSGR article, an investor would appreciate that if a company is growing at a rate equal to or less than the SSGR and it can convert its profits into cash flow from operations, then it would be able to fund its growth from its internal resources without the need of external sources of funds.
Conversely, if any company attempts to grow its sales at a rate higher than its SSGR, then its internal resources would not be sufficient to fund its growth aspirations. As a result, the company would have to rely on additional sources of funds like debt or equity dilution to meet the cash requirements to generate its target growth.
An investor may calculate the SSGR using the following formula:
SSGR = NFAT * NPM * (1-DPR) – Dep
Where,
- SSGR = Self Sustainable Growth Rate in %
- Dep = Depreciation rate as a % of net fixed assets
- NFAT = Net fixed asset turnover (Sales/average net fixed assets over the year)
- NPM = Net profit margin as % of sales
- DPR = Dividend paid as % of net profit after tax
(For systematic algebraic calculation of SSGR formula: Click Here)
An investor would notice that SSGR is dependent on net fixed asset turnover for assessing the sustainable growth rate for the company. However, in the case of IT services companies, fixed assets are not the primary determinant of revenue. Therefore, SSGR may not give the best conclusions for Accelya Solutions India Ltd.
As a result, we need to rely on the free cash flow generation ability of the company to assess the margin of safety in its business model.
b) Free Cash Flow (FCF) Analysis of Accelya Solutions India Ltd:
While looking at the cash flow performance of Accelya Solutions India Ltd, an investor notices that during FY2013-FY2022, it generated cash flow from operations of ₹991 cr. During the same period, it did a capital expenditure of about ₹213 cr.
Therefore, during this period (FY2013-FY2022), Accelya Solutions India Ltd had a free cash flow (FCF) of ₹778 cr (=991 – 213).
In addition, during this period, the company had a non-operating income of ₹80 cr and an interest expense of ₹16 cr. As a result, the company had a free cash flow of ₹842 cr (= 778 + 80 – 16). Please note that the capitalized interest is already factored in as a part of the capex deducted earlier.
While looking at the overall cash-flow position of Accelya Solutions India Ltd over the last 10 years (FY2013-2022), an investor notices that the company has used its free cash flow primarily in the following avenues:
- ₹676 cr as dividends excluding dividend distribution tax (DDT) to its shareholders. When DDT was applicable, then the company would have paid an additional 20% of the dividend amount as DDT.
- ₹45 as an increase in the cash & equivalents from ₹72 cr in FY2013 to ₹117 cr in FY2022.
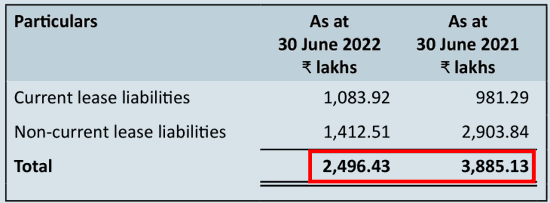
Please note that the debt seen on the books of the company in FY2020, FY2021 and FY2022 is not a debt from lenders; however, it is the future lease liabilities recognized as debt by the company as per the latest accounting standards.
Going ahead, an investor should keep a close watch on the free cash flow generation by Accelya Solutions India Ltd to understand whether the company continues to generate surplus cash from its business and whether it continues to use it largely to pay dividends to the shareholders.
Further advised reading: Free Cash Flow: A Complete Guide to Understanding FCF
Self-Sustainable Growth Rate (SSGR) and free cash flow (FCF) are the main pillars of assessing the margin of safety in the business model of any company.
Further advised reading: 3 Simple Ways to Assess “Margin of Safety”: The Cornerstone of Stock Investing
Additional aspects of Accelya Solutions India Ltd:
On analysing Accelya Solutions India Ltd and after reading annual reports, credit rating reports and other public documents, an investor comes across certain other aspects of the company, which are important for any investor to know while making an investment decision.
1) Management Succession of Accelya Solutions India Ltd:
Accelya Solutions India Ltd is currently owned by a private equity (PE) firm, Vista Equity Partners. As discussed earlier, once the founder-promoters (Mr Kale and Mr Jain) sold the company to Chequers Capital, it changed hands multiple times to various PE players.
The owners of the company no longer seem to focus on the long-term for business growth. They are prioritizing large cash payouts in the form of dividends instead of investing in R&D and employee strength. The lack of a longer-term vision of the new owners seems to have percolated the senior management as well.
As a result, once the founder promoter (Mr Jain) left the leadership of the company, the senior management of the company has seen a lot of churns.
The founder promoter, Mr Vipul Jain ran the company for almost 30 years from 1986 to FY2015. However, after he stepped down, the next managing director (MD), Ms Neela Bhattacherjee resigned in FY2021.
The next MD, Mr Shrimanikandan Ananthavaidhyanathan stayed in the job only for one year and resigned in FY2022.
Thereafter, the company had to find another MD, Mr Gurudas Shenoy. However, his appointment is yet not confirmed because he does not fulfil the precondition of staying in India for 12 months before he was appointed an MD.
FY2022 annual report, page 191:
Since Mr. Gurudas Shenoy was based in the US…he could not meet the requirement of…having stayed in India for a continuous period of twelve months preceding the date of his appointment as Managing Director.
Central govt. is yet to approve his appointment as the MD of Accelya Solutions India Ltd.
December 2022 quarter result, page 5:
Mr Gurudas Shenoy was appointed as managing director w.e.f. 01 July, 2022. The Company has filed application to the Central Government seeking as approval for his appointment as Managing director, which is still awaited.
Going ahead, an investor should keep a close watch on the changes in the senior management of the company to see whether any person is willing to continue to lead the company for a long time to generate good business growth in the long term. Or he/she also leaves the company after realizing the lack of growth opportunities due to a lack of desire of the owners to invest money back in the business for generating avenues for growth.
Further advised reading: How to do Management Analysis of Companies?
2) High remuneration to senior management by Accelya Solutions India Ltd:
As discussed previously, when Chequers Capital took over the company, the remuneration of Mr Vipul Jain increased sharply by more than 80% from about ₹1.5 cr in FY2010 to ₹2.7 cr in FY2011. This increase in remuneration was despite a decline of more than 20% in the net profit of the company in FY2011 over FY2010.
In FY2015, when Ms Neela Bhattacherjee became the MD of the company, then over and above his salary, the company paid a special bonus of ₹1 cr to Mr Jain when he became a non-executive director of the company.
FY2015 annual report, page 113:
The consent of the Company, be and it is hereby accorded to the payment of one-time special bonus of Rs. 10,000,000 (Rupees Ten Million only) to Mr. Vipul Jain as a gesture
Thereafter, Ms Neela Bhattacherjee became the MD and received a remuneration of ₹1 cr in the first year of her tenure (FY2016 annual report, page 24). When she left Accelya Solutions India Ltd in FY2021, she took home a remuneration of about ₹4 cr (FY2021 annual report, page 31). This is an increase of 4 times (an annualized increase of about 32%) whereas during this period the net profit of Accelya Solutions India Ltd declined about 50% from ₹83 cr in FY2016 to ₹42 cr in FY2021.
Advised reading: Are professionally managed companies safer for shareholders?
3) Foreign exchange and derivative losses:
Over the years, Accelya Solutions India Ltd suffered significant losses due to foreign exchange (forex) fluctuations and on the derivative contracts that it entered for hedging them, which indicates that the hedging policy of the company has room for improvement. For example:
- In FY2013, the company had a forex loss of ₹4 cr (FY2013 annual report, page 71).
- In FY2018, the company reported a forex loss of ₹2.3 cr (FY2018 annual report, page 149).
- In FY2019, the company faced a forex loss of ₹2.5 cr (FY2019 annual report, page 128).
- In FY2020, the company had a forex loss of ₹4.3 cr (FY2020 annual report, page 148).
- In December 2022 quarter, the company reported a forex loss of ₹2 cr (Dec. 2022 quarter results, page 9).
Other than these forex losses, the company had reported large mark-to-market (MTM) losses on the derivatives/forward contracts entered by the company.
- In FY2018, the company reported an MTM loss of ₹16 cr on a forward contract (FY2018 annual report, page 124).
- In FY2015 and FY2014, the company had MTM losses on forward contracts of ₹4 cr and ₹5.5 cr respectively (FY2015 annual report, page 82).
- In FY2013 and FY2012, the company had MTM losses on derivative contracts of ₹6.8 cr and ₹3 cr respectively (FY2013 annual report, page 54).
Going ahead, an investor should closely track the losses suffered by the company on its forex and derivatives transactions to understand whether it has improved its hedging strategies.
4) Tax demands from govt. authorities:
Over the years, the company had received significant tax demands from govt. authorities, which are shown under contingent liabilities.
For example, in FY2017, Accelya Solutions India Ltd received a demand notice for unpaid service tax of about ₹5 cr. As per the govt. authorities, the company should have deposited service tax under the reverse charge mechanism (RCM) for certain transactions, which it had not done. In addition, the company took Cenvat tax credit for some transactions for which it should not have taken the credit.
As a result, the govt. authorities demanded a sum of about ₹5 cr from the company.
FY2017 annual report, page 130:
Company has received Show Cause cum Demand notices on account of service tax demand amounting to ₹ 48,581,562 (excluding interest and penalty) by Service Tax authorities (Certain transactions were chargeable to tax under Reverse Charge Mechanism and Cenvat credit was not eligible for certain transactions
In the next year, the tax dept. heard the company’s case and ordered that the company should have paid the taxes. As a result, for the RCM section, it confirmed a tax demand and penalty of about ₹6 cr. The company has appealed against the order.
FY2018 annual report, page 171:
During the year, with respect to RCM, the Company has received an order from Central Tax & GST authorities where the commissioner has confirmed the demand of ₹29,560,902 and imposed penalty of ₹29,560,902 on the Company. The Company has filed an appeal
For the balance portion of the alleged wrong Cenvat credit, in FY2020, the department put a demand and penalty of ₹4.16 cr on the company. The company filed an appeal against the same.
FY2020 annual report, page 196:
Contingent liability on account of service tax demand and penalty by Service Tax authorities towards reversal of CENVAT credit on Mutual Fund transactions…The Company has filed an appeal against the same with Commissioner (Appeals). ₹41,620,997
Advised reading: How to study Annual Report of a Company
On June 30, 2022, the company has disclosed contingent liabilities of about ₹8.38 cr on account of tax demands where at the initial level the orders have come against the company. However, the company has filed appeals against them (FY2022 annual report, page 129).
An investor should track developments related to these tax demands as well as check whether the company receives more such tax demand notices in the future.
In FY2022, the company disclosed that its Goods and Services Tax (GST) refund receivables of about ₹1.4 cr are now doubtful (FY2022 annual report, page 167). The GST department might be planning to adjust these refunds against the outstanding tax demands. An investor may contact the company directly for reasons for declaring GST refunds as doubtful.
The Margin of Safety in the market price of Accelya Solutions India Ltd:
Currently (January 31, 2023), Accelya Solutions India Ltd is available at a price-to-earnings (PE) ratio of about 20 based on consolidated earnings of the last 12 months ending December 2022 (Jan. 2022 – Dec. 2022).
However, we recommend that an investor may read the following articles to assess the PE ratio to be paid for any stock, which takes into account the strength of the business model of the company as well. The strength in the business model of any company is measured by way of its self-sustainable growth rate and the free cash flow generating the ability of the company.
In the absence of any strength in the business model of the company, even a low PE ratio of the company’s stock may be a sign of a value trap where instead of being a bargain; the low valuation of the stock price may represent the poor business dynamics of the company.
- 3 Principles to Decide the Ideal P/E Ratio of a Stock for Value Investors
- How to Earn High Returns at Low Risk – Invest in Low P/E Stocks
- Hidden Risk of Investing in High P/E Stocks
Analysis Summary
Accelya Solutions India Ltd has seen its business growth slow down considerably in the last 10 years (FY2013-FY2022) as it could achieve sales growth of only 2% year on year. During this period, the net profits of the company declined.
The reasons for such a stagnating business performance are primarily two. First, the limited scope of growth in the outsourced airline services business where many airlines have in-house technology teams developing software as well as intense competition from other IT firms. The volatile nature of the airline industry, which is susceptible to economic and political turmoil, accentuates the growth issues.
Second, the new owners (private equity players) have focused on taking out money via high dividends from the company to return to their investors instead of letting the company invest that money for business growth by developing new products and hiring more employees.
As a result, the company is limited to the venerable airline industry without attempting to develop new products to diversify into other industries.
The subdued growth potential seems to be the reason why the founder-promoters sold their stake in the company and Mr Jain preferred to become an employee for the company instead of its owner. Apparently, the lack of growth potential led each successive private equity owner to sell off the company shortly after they acquired it.
The high churn among the promoters also seems to have percolated senior management because recently, the company has seen frequent exits at the managing director level.
Even though the company had tried to make its revenues more sustainable by going for a per-transaction billing. However, the high susceptibility of air travel to various events and the high negotiating powers of its large airline customers have brought volatility in its business performance over the years.
The company had to witness significant write-offs of its trade receivables, unbilled receivables, withholding tax etc. as during tough times, the financial health of its customers declined and it could not recover money from them.
In recent times, the company has paid out large dividends to its shareholders because the successive private equity owners seem to have prioritized dividends payouts over investments in the business of the company.
In the past, when the founder-promoters were investing for growth, the company’s cash generation ability fell short of its funds’ requirements and the promoters had to infuse money via share and warrant subscription multiple times. In addition, the company had to raise money via debt as well as by selling its properties to fund its acquisitions.
Along similar lines, in case, the company decides to grow its business aggressively, then the dividends may see a decline and the company might have to go for equity dilution in the future.
Going ahead, an investor needs closely monitor the cash flows of the company to note if it still deprioritizes its business growth over high dividend payouts. She also needs to check whether the company is able to collect its receivables in time without having to write them off.
The investor also needs to monitor whether the salary of senior management of the company increases at a higher pace than the business and profits of the company. She also needs to check its tax liabilities and if it continues to have large forex and derivative losses.
Further advised reading: How to Monitor Stocks in your Portfolio
These are our views on Accelya Solutions India Ltd. However, investors should do their own analysis before making any investment-related decisions about the company.
You may use the following steps to analyse the company: “Selecting Top Stocks to Buy – A Step by Step Process of Finding Multibagger Stocks”
I hope it helps!
Regards,
Dr Vijay Malik
P.S.
- Subscribe to Dr Vijay Malik’s Recommended Stocks: Click here
- Chennai “Peaceful Investing” Workshop | 26 July 2026: Register Here
- To learn stock investing through videos, you may subscribe to the Peaceful Investing – Workshop Videos
- 25% savings on buying our Stock Analysis Excel Template and all ebooks together: Analysis Package: Excel Template + All eBooks (25% savings)
- To download our customized Stock Analysis Excel Template for analysing companies: Stock Analysis Excel
- Learn about our stock analysis approach in the e-book: “Peaceful Investing – A Simple Guide to Hassle-free Stock Investing”
- To learn how to do business analysis of companies: e-book: Business Analysis Guide
- To pre-register/express interest in a “Peaceful Investing” workshop in your city: Click here
Disclaimer
I, Vijay Malik, am a SEBI-registered Research Analyst (Regn. No. INH100008364). This article is for educational purposes only and does not constitute investment advice or a recommendation to buy or sell any securities. Investors should do their own research before making any investment decisions.
I, or my immediate relatives, do not have any financial interest in the companies discussed as on the date of publication of this article, nor do we hold one per cent or more of the securities of such companies at the end of the month immediately preceding it. I do not have any material conflict of interest and have not received any compensation or other benefits from the companies or any third party in relation to this article during the 12 months preceding its publication. I have not served as an officer, director, or employee of the subject companies, nor have I been engaged in market making activity for them.


