The current section of the “Analysis” series covers Laurus Labs Ltd, an Indian pharmaceutical company focusing on the production of APIs, formulations as well as the custom synthesis of drugs in antiretroviral (HIV), Oncology, Hepatitis-C, Diabetes, Cardiovascular diseases etc.
“Analysis” series is an attempt to share with all the readers, our inputs to the company analysis submitted by readers on the “Ask Your Queries” section of our website.
Please note that to benefit the maximum from this article, an investor should focus on the process of analysis instead of looking for good or bad aspects of the company. She should learn the interpretation of different types of data and transactions and pay attention to the parts of annual reports etc. used to get the information. This will help her in improving her stock analysis skills.
Laurus Labs Ltd: Detailed Fundamental Analysis
While analysing the history of Laurus Labs Ltd, an investor notices that in 2014, it had purchased a 100% stake in Viziphar Biosciences Private Limited to make it a wholly-owned subsidiary. As a result, in its red-herring prospectus (RHP) before its initial public offer (IPO) in December 2016, it disclosed consolidated financial statements from FY2014 onwards.
Thereafter, Laurus Labs Ltd has established many Indian and overseas direct subsidiaries, step-down subsidiaries, associates etc. As per the FY2022 annual report, page 52, on March 31, 2022, Laurus Labs Ltd had 7 subsidiary companies including 5 wholly-owned subsidiaries and one associate company. Therefore, from FY2014 onwards, Laurus Labs Ltd has continued to report standalone as well as consolidated financials. However, before FY2014, the company used to report only standalone financials.
We believe that while analysing any company, an investor should always look at the company as a whole and focus on financials, which represent the business picture of the entire company including its subsidiaries, joint ventures etc. The consolidated financials of a company present such a picture.
Further advised reading: Standalone vs Consolidated Financials: A Complete Guide
Therefore, in the case of Laurus Labs Ltd, during the last 10 years, we have analysed standalone financials for FY2013 and consolidated financials from FY2014 onwards.
With this background, let us analyse the financial performance of Laurus Labs Ltd.

Financial and Business Analysis of Laurus Labs Ltd:
Sales of Laurus Labs Ltd have grown at a pace of 24% year on year from ₹719 cr in FY2013 to ₹4,936 cr in FY2022. The sales of the company have increased every year since FY2013. Moreover, during the FY2019-FY2021 period, the sales growth of the company increased to 45% year-on-year when the sales of Laurus Labs Ltd increased sharply from ₹2,292 cr in FY2019 to ₹4,814 in FY2021.
The operating profit margin (OPM) of the company has shown a cyclical pattern. Initially, the OPM declined from 20% in FY 2013 to 15% in FY2015. Thereafter, OPM increased to 21% in FY2017 only to decline to 16% in FY2019. However, thereafter, the OPM increased sharply to 32% in FY2021. In FY2022, Laurus Labs Ltd had an OPM of 29%. Over FY2013-FY2022, the net profit margin (NPM) of Laurus Labs Ltd has followed the same pattern as its OPM.
To understand the reasons for the financial performance of Laurus Labs Ltd, an investor needs to read the publicly available documents of the company like its annual reports from FY2014 onwards, RHP for its IPO, conference calls, and credit rating reports as well as its corporate announcements. Then she would understand the factors leading to its consistently increasing sales with a sharp increase during FY2019-FY2021 as well as its fluctuating profit margins.
In addition, it would help an investor if she read the following article about the business analysis of pharmaceutical companies: How to do Business Analysis of Pharmaceutical Companies
The above article highlights the business environment and the challenges faced by different companies operating in the pharmaceutical industry like bulk drugs/API (active pharmaceutical ingredient) manufacturers, formulation (read to consume) drug manufacturers, contract research and manufacturing (CRAMS) players as well as distributors. It also highlights the steps each of these companies takes to increase their competitive advantage.
After going through the above-mentioned article and the documents, an investor notices the following key factors, which have led to the significant improvement in the business of Laurus Labs Ltd, which she needs to keep in her mind before making any predictions about the performance of the company.
1) Diversification from ARV API into formulations and CRAMS:
One of the biggest strategic decisions taken by Laurus Labs Ltd, which has contributed immensely to the growth of its business is to diversify out of anti-retroviral (ARV) APIs focusing on the treatment of Human Immunodeficiency Virus (HIV) and enter into segments like formulations and CRAMS (synthesis division). It has led to a significant increase in revenues as well as profit margins.
Originally, the business of Laurus Labs Ltd was highly dependent on APIs. The company had started thinking about diversification out of APIs into formulations as well as starting materials & intermediates in FY2014.
FY2014 annual report, page 23:
Company aspires to extend from the manufacture of APIs to formulations in the near future that derives a third of its revenues from key starting materials and intermediates, a third from APIs and a third from formulation, over the foreseeable future.
Therefore, over the years, it made significant investments to create formulations and synthesis capacities. Finally, it could move its business away from the concentration around APIs.
The following chart from the April 2022 presentation of Laurus Labs Ltd indicates the significant diversification achieved by the company over the last 5-years.

The share of ARV APIs has declined from 80% in FY2017 to 25% in FY2022. At the same time, the share of formulations has increased to 38%. Synthesis (CRAMS) now contributes about 19% of revenues and APIs other than ARV i.e. focusing on cancer therapy (Oncology), anti-allergic, diabetes, heart diseases etc. contribute 16% to the revenue.
Let us try to understand how the efforts by Laurus Labs Ltd to diversify away from ARV APIs have helped its business.
1.1) Formulations have helped Laurus Labs Ltd to immensely grow its sales as well as profitability:
Formulations players manufacture ready-to-consume drugs and sell them in the market. They are at a higher level in the pharmaceutical value chain and are supposed to have a better business profile than API/bulk drug manufacturers.
Rating Methodology – Pharmaceutical Sector by the credit rating agency, CARE, June 2017, page 7:
Formulation manufacturers, being closest to the market, are at a higher point in the pharmaceutical value chain compared to API and intermediate manufacturers and hence, are likely to have a superior business risk profile
Therefore, when Laurus Labs Ltd entered formulations, then it strengthened its business profile and competitive advantages. It focused on manufacturing formulations only from its own APIs. Therefore, it could capture a higher share of value addition in the pharmaceutical value chain i.e. value in creating APIs as well as the value in creating formulations.
Conference call, August 2017, page 8:
Dr. Satya: Interestingly, all our Formulations what we have in our portfolio, we have our own APIs. So far in our portfolio, current or in the near future, we are not anticipating that we will buy third-party API and do formulations.
This decision helped Laurus Labs Ltd earn a higher profit margin when it sold a larger quantity of formulations/finished dosage forms (FDFs). The company highlighted this aspect to its investors in January 2020 conference call, page 8:
V.V. Ravikumar:…FDF business is certainly helping us to increase our gross margins because we are getting more gross margins on APIs for sure in formulation business.
The credit rating agency, CARE also highlighted in its report of June 2020 that the profit margins of Laurus Labs Ltd have improved due to increased contribution from the formulations segment.
profitability has increased due to change in composition of revenue from API to formulations
The ability of Laurus Labs Ltd to gain a higher share of value-addition by entering into formulations brought strength to its business model because it could face pricing pressures in a better manner.
Conference call, October 2020, page 7:
Dr. Satyanarayana Chava: Since we became an integrated player in ARV formulations, we believe we will have ability to weather the pricing challenges.
In fact, continued pricing pressure in the pharmaceutical industry, which was enhanced by the consolidation of distributor companies in the USA was one of the reasons for Laurus Labs Ltd to enter into formulations.
Conference call, May 2017, pages 4-5:
Kunal Mehta:..we have been seeing channel consolidation in the US. That is affecting the prices of Formulations. So from a perspective of API supplier to those companies, how do the price decreases affect the API suppliers..?
Dr. Chava: The price pressure in US definitely put some stress on the APIs. They are buying from a third party. If they are vertically integrated, they can withstand pressure much better than the non-integrated companies. That was one of the reasons for us to foray into Finished Dosage Forms
From the above article shared on the business analysis of pharmaceutical companies, an investor would note that one of the steps that generics players take to increase competitive advantage is by becoming vertically integrated.
No wonder the vertical integration by Laurus Labs Ltd into formulations has increased the competitive advantage of the company in the face of other large pharma companies selling ARV drugs.
Conference call, November 2018, page 14:
Dr. Satyanarayana Chava: The lion share of the market is with Mylan, Aurobindo, Hetero and Cipla, but we are fully integrated so that is the only advantage we have.
In formulations, Laurus Labs Ltd focused on three key segments:
- Selling formulations of ARV (HIV) drugs, selling non-ARV drugs to lower & middle-income countries (LMIC),
- Making formulations for customers in Europe and other developed markets i.e. custom synthesis, CRAMS and
- Selling formulations of non-ARV drugs in the US and other developed markets under its own brand names.
All these three segments were almost non-existent/very small at the time of IPO in FY2017. Therefore, when these segments grew, they straightaway added to the revenues of Laurus Labs Ltd. For example, during the FY2019-FY2021 period, when the company grew its sales at an annual growth rate of 45%, the major contribution came from the formulations segment, which grew from a small level of ₹5 cr in FY2019 to ₹825 cr in FY2021.
FY2021 annual report, page 12:
formulation segment, growing 165x from ₹5 crore to ₹825 crore from 2018-19 to 2020-21.
The formulations segment/finished dosage forms (FDF) further increased to about ₹1,875 cr in FY2022 (i.e. 38% of FY2022 revenues of ₹4,936 cr).
The growth of the FDF (formulations) segment has been a new business for Laurus Labs Ltd without eating into its own API business because the company is avoiding taking away the market share of its customers.
Conference call, August 2018, pages 15, 18:
Dr. Satyanarayana Chava: This will be incremental. We did not expect any cannibalization
Nitin Agarwal: So you are not necessarily sort of trying to grab market share in the current customers?
Dr. Satyanarayana Chava: Yes.
Moreover, the company has made sure that its API supplies to its existing customers continue without disruption. As a result, it has created additional API capacities for its own formulation manufacturing.
Conference call, May 2018, page 20:
Dr. Satyanarayana Chava:…it is not an activity where we are not doing without knowledge of our current customers so we also made very clear we are creating enough capacity such that we will not hamper any deliveries to our existing clients.
As a result, due to large investments in the formulations business, Laurus Labs Ltd could generate an additional business of about ₹1,875 cr over FY2020, FY2021 and FY2022, which contributed significantly to its sales as well as profitability.
Going ahead, Laurus Labs Ltd has decided to further increase its formulation capacity significantly as a part of the capacity expansion plans of ₹2,000 cr to ₹2,500 cr in FY2023-FY2024.
1.2) Entry into custom synthesis (CRAMS) business increased the profit margins and reduced the risk for Laurus Labs Ltd:
CRAMS/synthesis business of Laurus Labs Ltd is one of its highest-margin business segments. Therefore, as the share of the synthesis business increases in the revenues of Laurus Labs Ltd, its profit margins increase.
Conference call, November 2017, page 6:
Dr. Satyanarayana Chava: So we had improved sales in our Synthesis business where our margins are significantly higher than our other businesses.
In fact, the contract manufacturing business of Laurus Labs Ltd from Aspen group is the highest margin business.
Conference call, January 2020, page 21:
Dr. Satyanarayana Chava: Absolutely, this is the highest margin business right now.
As a result, an improvement in the synthesis business added to the significant increase in the profit margins of Laurus Labs Ltd during FY2020-FY2022.
FY2020 annual report, page 45:
This represents PAT margins of 9.0% of revenue versus 4.1% in 2018-19. This increase is due to improved performance from businesses like FDF and Custom Synthesis.
By achieving an increase in the contribution from the synthesis business, Laurus Labs Ltd has reduced risk in its overall business because as per the company, this business comes with very low development risk and without pricing pressure.
Conference call, July 2020, page 21:
Dr. Satyanarayana Chava: Synthesis business…is also very interesting business because there is no development risk, because customer will give you the product, basic process and you optimize and start giving. And there is no price pressure. Volume will only go up if molecule moves from early clinical phase to advanced phases in commercial.
Moreover, Laurus Labs Ltd has been able to get some very good business terms from its synthesis customers. Under one such favourable term, its customers provide it funding when it creates a dedicated manufacturing unit for them.
Last year when Laurus Labs Ltd signed a multi-year contract-manufacturing contract with a global life sciences company, then the customer agreed to provide funding for its manufacturing plant.
Conference call, October 2021, page 2:
Dr. S. Chava:…signed a multi-year supply contract with a global life science company during the quarter…also set up a dedicated manufacturing site to cater to the demand. Part of these CAPEX will be funded through long-term commercial advance apart from sponsoring development costs.
Similarly, in the past, one of its customers, the Aspen group of South Africa has also funded the fixed costs of the dedicated manufacturing unit.
Conference call, November 2017, page 5:
Dr. Satyanarayana Chava: So we have an agreement where we will recover all the fixed expenditure and we get cost plus certain percentage…On the day one itself in Unit 5, we are not incurring any losses right now. We are recovering all the expenses of Unit 5 from Aspen.
Conference call, January 2018, page 3:
V.V. Ravi Kumar: We have started billing to the Aspen on the fixed expenses, though we have supplied first validation quantity in October 2017, still there are unrecovered fixed cost that are getting reimbursed.
When Laurus Labs Ltd entered into an arrangement with Natco Pharma about making APIs for Hepatitis-C drugs, then the agreement allowed for Laurus Labs Ltd to earn money on the sale of API to Natco as well as 50% of profits that Natco generated from the sale of Hepatitis-C drugs (formulations) using the APIs of Laurus Labs Ltd.
RHP, December 2016, page 49:
Our Company has entered into an arrangement to manufacture and sell Hepatitis C APIs with NATCO, who commands a 38.5% share of the Indian Hepatitis C market
Conference call, August 2017, page 11:
Dr. Satya: For Hep-C, we are supplying all the APIs required for the portfolio – one is made by Natco. So majority of our API sales in Hep-C goes to Natco.
Dr. Satya: We mentioned in many occasions. We supply API and we get 50% of the profits on the brands
The company has similar profit-sharing contracts with other customers like US-based Citron Pharma and Dr Reddy’s.
RHP, December 2016, page 51:
We currently have contracts with generic pharmaceutical companies such as Citron Pharma LLC (“Citron”), NATCO and Dr. Reddy’s Laboratories Limited for the development of finished dosage products in the several therapeutic area on a profit and cost sharing basis.
Therefore, such liberal business terms with customers in the synthesis/CRAMS business help in reducing the business risk of Laurus Labs Ltd.
As a result, Laurus Labs Ltd intends to increase the share of the synthesis business from 19% in FY2022 to 25% by FY2025.
Conference call, January 2022, page 17:
Jeevan Patwa: How much you basically see your synthesis business in next three years or four years?
Dr. S Chava: By FY ‘25 we want this business to be at least 25% of our overall revenue.
1.3) Oncology API segment is a high margin, but low volume business:
As an additional source of diversification, Laurus Labs Ltd has also created a large capacity in APIs for cancer treatment (Oncology) because it is also one of the high-margin businesses.
Conference call, April 2020, page 9:
Dr. Satyanarayana Chava: We have the largest Onco API capacities in the country.
Increasing contribution from the Oncology API segment has added to the increased profit margins of the company.
Conference call, August 2017, page 3:
V.V. Ravikumar:…EBITDA margins have increased by 50 bps. So this is on account of the higher volumes relating to…Oncology and then Synthesis business, where you are all aware that the gross margins are higher.
However, Laurus Labs Ltd is not expecting a lot of growth from the Oncology API segment because it is a high-margin-low-volume business.
Conference call, January 2020, page 6:
Dr. Satyanarayana Chava: We do not expect to significant growth coming from Onco APIs. In the Onco APIs as you are aware, the volume is low and Despite of having very large capacities the value growth translation is quite low, which is the nature of Onco business.
Therefore, investors should keep this aspect of the Oncology API business in mind while projecting the performance of Laurus Labs Ltd in future.
Advised reading: How to do Business Analysis of Pharmaceutical Companies
1.4) Further diversification in recombinant technology:
In FY2021, Laurus Labs Ltd acquired a majority stake in Richcore Lifesciences Pvt. Ltd and renamed it Laurus Bio Private Limited.
The acquisition provided it access to recombinant technology, which it did not have. In addition, the acquisition saved Laurus Labs Ltd almost 6-7 years that it would take to develop recombinant technology in-house.
Conference call, November 2020, page 6:
Dr. Satyanarayana Chava: We have the expertise in biocatalysis and fermentation but we do not have any expertise in recombinant. The idea for us to acquire this capability is to shorten our gestation period, if we start Greenfield, it will take six to seven years. By this acquisition, we will cut out the gestation period significantly
Moreover, the newly acquired business has high-profit margins, which will improve the profitability of Laurus Labs Ltd as it grows.
Conference call, November 2020, page 4:
Dr. Satyanarayana Chava: These products are very high margin business I could see from the gross margins of about 70%.
As a result, the company is planning to significantly increase the capacity of Laurus Bio Private Limited. After, its acquisition in FY2021, when it had a fermentation capacity of 10,750 liters, in FY2022, it increased the fermentation capacity by 180,000 liters.
Conference call, January 2022, page
Dr. S. Chava: During the quarter, Laurus Bio commissioned two more fermenters of 45KL each taking to total capacity of 180KL.
The newly expanded fermentation capacity of 180,000 liters was already tied up with a prospective customer even before it was completed.
Conference call, November 2020, page 7:
Dr. Satyanarayana Chava: And currently, the new plant one is being built and will be operational by March 2021 is already sold, the capacity sold to one customer as part of the CDMO.
Therefore, Laurus Labs Ltd is looking to aggressively grow this segment and has purchased land for increasing the fermentation capacity by about 3-4 million liters out of which about 1 million liters will be added in the first phase.
Conference call, January 2022, pages 17 and 18:
Dr. S Chava: Yes, they have taken land. Okay. 30 acre land…They will put in a phased manner of 1 million plus 1 million plus one. In fact, the land can accommodate up to 3 million litre fermentation capacity.
Therefore, going ahead, an investor should closely monitor the performance of Laurus Bio Private Ltd and the execution of its capacity expansion projects to assess whether they are completed on time and with cost estimates or not.
2) Being prepared in advance for changes in ARV/HIV treatment guidelines:
Laurus Labs Ltd has stated that whenever there is any disruption in its business segments, then it wants to be a part of it i.e. it wants to actively gain from such disruptions instead of reacting and recovering from their aftereffects.
Conference call, January 2021, page 15:
Dr. Satyanarayana Chava:…we are in ARV business since last two decades and we are watching the developments very carefully. And if there is a disruption, we want to be part of the disruption rather than follow it.
As a result, when the HIV/ARV treatment had a major shift from Efavirenz-based combination drugs (TLE: Tenofovir, Lamivudine and Efavirenz) to Dolutegravir-based combination drugs (DLT: Dolutegravir, Lamivudine and Tenofovir), then Laurus Labs Ltd was ready in advance with manufacturing capacities to benefit from it.
Previously, Efavirenz-based therapy was the mainstay of ARV/HIV therapy and Laurus Labs Ltd had a very large market share in the APIs for this therapy. In FY2014, Efavirenz-based therapy had 60% of HIV drugs and Laurus Labs Ltd had a 50% global market share in Efavirenz API. At that time, Efavirenz API constituted 50% of the revenues of the company.
FY2014 annual report, page 26:
Efavirenz: Within a short span of five years, the product has emerged as the largest grosser for Laurus Labs, accounting for 50% of revenues. Laurus thus achieved global leadership via the manufacture of Efavirenz API which caters to the needs of more than 60% of HIV patients under drug therapy worldwide and enjoys a global market share of around 50 %.
Therefore, an investor would appreciate that a shift from Efavirenz-based therapy to Dolutegravir-based therapy was a major challenge for Laurus Labs Ltd because Efavirenz constituted about 50% of its revenues in FY2014. In addition, the new drug, Dolutegravir was needed in a much lower quantity (50 mg) than the existing drug, Efavirenz (600 mg). Therefore, it was looking at a 12 times reduction in the API quantity.
Conference call, August 2017, page 12:
Dr. Satya: As you are aware from the dose, Dolutegravir is 50 mgs and Efavirenz is 600 mgs. The amount of API required is one-twelfth.
However, the company decided to handle this upcoming disruption in two steps. First, it created the manufacturing capacity of Dolutegravir in advance before the tenders for ARV/HIV treatment started asking for it. In addition, the company also created a large manufacturing capacity for Lamivudine so that it could grow from a simple API supplier of ARV drugs to a formulator i.e. producing ready-to-consume triple combination drug (DLT).
Conference call, May 2018, page 6:
Dr. Satyanarayana Chava: During this quarter FY2019 we are going to inaugurate one of the largest capacity for the Lamivudine and we are adding capacity for Dolutegravir even though there will be a new enrolment happening in Dolutegravir we do not expect significant shift from one therapy to another therapy.
Laurus Labs Ltd increased its manufacturing capacity for Dolutegravir so much that it could meet its own formulation requirement as well as sell the API outside to meet the needs of other customers.
Conference call, November 2019, page 6:
Dr. Satyanarayana Chava: So we have increased our capacity of Dolutegravir significantly and we are able to meet our demand, we also did supply some from quantities to third party customers.
Laurus Labs Ltd did not want to miss its market leadership in the ARV/HIV drug segment, which it had created over the years. Therefore, it made large investments in the capacities of Dolutegravir and Lamivudine so that it could make up for any loss in business from Efavirenz and it could maintain its revenue from ARV/HIV drugs.
Conference call, February 2019, page 3:
Dr. Satyanarayana Chava:…Dolutegravir and Lamivudine are not in our current sales, any loss of Efavirenz market share will be compensated by sales of Lamivudine and Dolutegravir, so we strongly believe ARV we will definitely maintain the franchisee at the same level and still we continue to grow.
Over the next year, in FY2020, the ARV/HIV drug tenders started changing, Dolutegravir started making its presence in the place of Efavirenz, and the sale of ARV API business of Laurus Labs Ltd started declining.
Conference call, November 2019, page 3:
Dr. Satyanarayana Chava:…ARV API business it continues to slow down, it has degrown by 23% year-on-year…fall in this growth is mainly led by change in treatment regimen from Efavirenz to Dolutegravir
Soon, Dolutegravir-based therapies took over about 70% market share of the first-line of ARV/HIV treatment.
Conference call, July 2020, page 11:
Dr. Satyanarayana Chava: In the first line DLT treatment occupies maybe 70% of the market share, remaining 30% is done through TLE or TEE
Despite this significant change in the ARV/HIV treatment drugs away from its main product (Efavirenz), Laurus Labs Ltd was able to quickly gain a significant market share in the new line of drugs. In FY2021, it had about one-third global market share in the overall API & formulations segment of ARV/HIV drugs.
Conference call, October 2020, pages 10, 11, and 13:
Nitin Agarwal: 30%, 35% of the TLD market, we are present either through API or through formulations.
Dr. Satyanarayana Chava: That is a good assumption, yes.
Therefore, Laurus Labs Ltd could successfully handle a large change in the ARV market by strategically creating manufacturing capacities in the new drugs/APIs and then benefit from this change by positioning itself as a triple-combination drug (DLT) formulation supplier instead of being a simple API supplier. Moreover, it achieved this without compromising its API sales to third-party existing customers because; the company created additional API capacities to meet its own formulation requirements.
These steps helped Laurus Labs Ltd in maintaining its market leadership position in the ARV market, expand its business in the formulations segment as well as improve its profit margins.
Currently, the company is expanding its presence in the second-line drugs for ARV/HIV treatment.
3) Backward integration into intermediates to ensure supply of raw material:
Laurus Labs Ltd does not enter into long-term supply contracts with its suppliers. Therefore, it faces the risk of increasing raw material prices whenever there is any challenge in its supply chain.
RHP, December 2016, page 478:
We typically do not enter into long term supply contracts with any of our vendors and instead place purchase orders with them from time to time. We are thus exposed to fluctuations in availability and prices of our raw materials
During FY2019, Laurus Labs Ltd faced challenges in getting raw material (intermediates) to produce ARV APIs and it had to pay a high price to get the same.
Conference call, August 2018, page 5:
V.V. Ravi Kumar:…China is getting more stricter into the environmental issues and they have started closing down the factories on a short notice and because of that the material availability is not a question, but the prices have shot up and since we cannot lose the production, we procured the materials at an higher price.
For some of the intermediates, the prices increased by up to 80%.
Conference call, August 2018, page 19:
Nimish Mehta:…what is the price increase that you have seen in this two products, Emtricitabine and Lamivudine, if you can just percentage price increase that would be helpful?
Dr. Satyanarayana Chava: For the intermediate the price is for as high as 80%.
An increase in raw material prices from China was one of the reasons for a decline in the OPM of Laurus Labs Ltd in FY2019 to 16% from 20% in FY2018.
Credit rating report, CARE, June 2019, page 2:
Decline in profitability margins during FY19: The decline in PBILDT level of the company was primarily due to increase in major raw material costs which are being sourced from China.
Advised Reading: Credit Rating Reports: A Complete Guide for Stock Investors
As a result, the company decided to make the intermediates for ARVs, Emtricitabine and Lamivudine in-house so that it does not stay dependent on China for them.
As a result, of this backward integration, Laurus Labs Ltd could recover about 2% in EBITDA margins out of the 3% that it had lost in the ARV segment due to high intermediate prices from China.
Conference call, November 2018, pages 3 & 6:
Dr. Satyanarayana Chava: We are also happy to share we have completed backward integration of our key ARV products Emtricitabine and Lamivudine and we see the benefit will come from Q3 onwards.
Dr. Satyanarayana Chava: We expect gross margins to improve by ~2% points because of backward integration.
Ananda Padmanand: And to what extent they would have eroded…?
Dr. Satyanarayana Chava: I would say maybe 3% I am talking about overall ARV as a basket.
The backward integration for ARV intermediates helped in an increase in the profit margins for the company in FY2020.
Conference call, August 2019, page 4:
Dr. Satyanarayana Chava: The backward integration plan for ARV intermediates to derisk supply chain challenges coming from China were completed successfully and that was the reason our gross margins improved
Subsequently, in FY2020, the company faced challenges in getting raw material for its Oncology API, Gemcitabine from China. Even then, it decided to make its intermediate in-house.
Conference call, August 2019, page 8:
V.V. Ravikumar:…one of our key Oncology product Gemcitabine had an issue because of the supply chain issues from China. We have initiated an in-house manufacturing of that intermediate and probably from September onwards we are geared up to produce
Within a few months, Laurus Labs Ltd completed the backward integration for the intermediates for Gemcitabine and it could reduce its reliance on imports from China and make its business model stronger.
Conference call, November 2019, page 7:
Dr. Satyanarayana Chava:…it was successfully completed and currently whatever Gemcitabine we are producing we are using is by using our in-house intermediate only. We are not buying intermediates from China for the last two to three months.
When the company faced challenges in getting raw materials from China in FY2018, then Laurus Labs Ltd also decided to set up a dedicated R&D unit to focus on intermediates and strengthen its supply chain.
Conference call, November 2018, page 17:
Dr. Satyanarayana Chava: Our Vizag R&D expansion is to boost our efforts towards backward integration….will focus more on starting meters and intermediate to have more control on supply chain.
Therefore, an investor would appreciate that whenever Laurus Labs Ltd faced challenges in sourcing raw material, then it took the occasion as an opportunity to strengthen its business model so that it does not face such challenges in the future.
This increase in the strength in the business model of Laurus Labs Ltd is reflected in the increasing credit rating of the company over the years.
In 2010, the credit rating agency, CARE has assigned it a credit rating of BB+, which indicated a very high credit risk and a high possibility of default. It was because; the company was continuously making cash losses since its inception.
Credit rating report, CARE, April 2010, page 1:
CARE has assigned ‘CARE BB+’ (Double B Plus) rating to the long-term bank facilities of Aptuit Laurus P Ltd. (Laurus)….Facilities with this rating are considered to offer inadequate safety for timely servicing of debt obligations. Such facilities carry high credit risk.
The ratings factor in limited track record of the company, cash losses since commencement of commercial operation in Q3 FY’08,
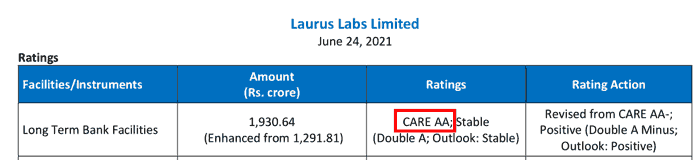
However, in about the next 10 years, in 2021, CARE has improved the credit rating of the company to AA, which indicates a very low credit risk and is only two steps below the highest possible credit rating of AAA.
Credit rating report, CARE, June 2021, page 1:
Going ahead, an investor should monitor the business performance of the company closely to assess whether it is able to maintain the strength of its business model.
4) Low pricing power over its customers:
Laurus Labs Ltd has primarily been a generics player making APIs and formulations for drugs, which were originally made by innovator large MNC pharma companies. Laurus Labs Ltd is able to make these drugs as either their patents have expired or it has licensed these drugs from the patent owners. Such products/drugs are commodities where the drug produced by one company are the same as the drugs produced by another company. This leads to intense competition in the pharmaceutical industry.
RHP, December 2016, page 27:
The pharmaceutical industry is a highly competitive market with several major pharmaceutical companies present, and therefore it is challenging to improve market share and profitability.
As a result, generics API as well as formulations companies do not have a lot of pricing power over its customers. The same is true for Laurus Labs Ltd even though it has a very high global market share for many of its products.
The company intimated to its shareholders about this weakens in the FY2019 annual report, page 47:
Weakness: Does not have much pricing power in products in which it has significant market share
In FY2019, when the company had to buy intermediates from China at high prices, then it could not get a price hike from its customers like Aspen group, South Africa.
Conference call, August 2018, page 6:
Dr. Satyanarayana Chava: we sell significant volumes to our partner Aspen where we had a three-year price agreement for all three APIs we sell, Efavirenz, Tenofovir and Emtricitabine. We are still talking to them for the price increase so far we are not successful
Laurus Labs Ltd realized that it could not get a complete pass on the increase in raw material costs. At the most, the customers would agree to a partial increase in prices and Laurus Labs Ltd would have to take a hit on its profit margins.
Conference call, August 2018, page 13:
Dr. Satyanarayana Chava:…we cannot pass on 100% that much we are very clear. We are putting our best efforts to partially pass on this to customers
Another factor leading to weak pricing power for pharmaceutical companies is the active control by govt. on drug prices.
Laurus Labs Ltd faced it when Govt. of India put control on some of the Hepatitis-C drugs that the company used to supply API to Natco Pharma. As a result, its Hepatitis C drugs segment witnessed a sharp decline in performance.
RHP, December 2016, page 23:
from April 2016, the NPPA brought Sofosbuvir, one of our key products in the Hepatitis C therapeutic area, under price control.
Conference call, January 2018, page 2:
Dr. Satya: We have seen significant pricing pressure in the API as well as in the Formulations, and also please note that actually some of HEP-C formulations came under DPCO.
Going ahead, an investor should keep these pricing-related challenges in her mind while she estimates future profit margins of Laurus Labs Ltd.
In fact, the company has also realized that it would not be able to gain price increases from its customers. Therefore, it has also stopped factoring in price increases in its business targets.
Conference call, April 2021, page 11:
Dr. Satyanarayana Chava: Our growth is not driven by price hikes…we have not done that in FY’21, I do believe we will never do that in FY’22 also.
In FY2022, the profit margins of the company declined to 29% from 32% in FY2021 due to an increase in raw material and logistics costs; however, it could not pass it on to maintain its profit margins.
Credit rating report, CARE, June 2022, page 1:
PBILDT margin reduced but remained strong at 28.99% in FY22 from 32.48% in FY21. This reduction was due to increase in the cost of certain raw materials and high cost of logistics during the COVID-19 crisis
Further advised reading: How to do Business Analysis of a Company
5) Strong focus on research & development by Laurus Labs Ltd:
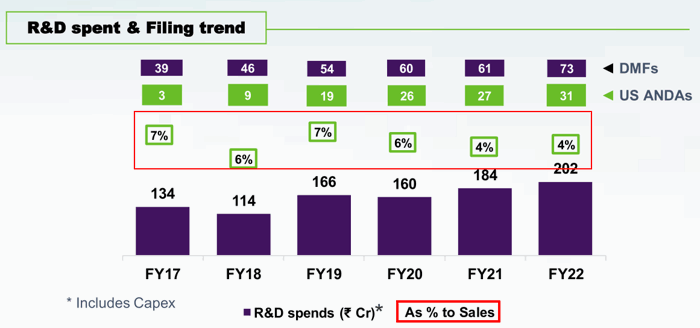
Laurus Labs Ltd has always kept a very strong focus on research & development (R&D). On average, the company spends about 4% – 7% of its sales on R&D.
Investors’ presentation, April 2022, page 17:
In FY2022, the company had about 790 employees in the R&D department, which was about one-fourth of the total employees of the company.
Credit rating report, CARE, June 2022, page 2:
The R&D facility is staffed by over 790 R&D professionals (around 24% of the total employee strength) in over 55 laboratories.
The company has focused on R&D right from its inception even when its business was at its initial stages. As per the credit rating report by CARE in April 2010 (page 2), the company made cash losses and one of the reasons for these cash losses was its high spending on R&D.
The losses were mainly due to the significant expenditure towards R&D projects along with high interest expenses and salary expenses.
The R&D capabilities of the company have helped the company in becoming the lowest-cost producer of multiple APIs like ARV/HIV drugs. As a result, it could capture a large global market share. R&D capabilities have also helped Laurus Labs Ltd gain access to reputed customers like Aspen, Mylan, Aurobindo Pharma, Natco, Sun Pharma, and Cipla and retain their business for a long period.
Credit rating report, CARE, July 2018, page 1:
existing customers for more than a decade in the anti-retroviral and Oncology like Aspen Pharmacare, Mylan Laboratories, Aurobindo Pharma, Natco Pharma Limited, Sun Pharmaceutical Industries Limited, Cipla Limited.
When in FY2019, the supply chain in China faced problems, then many companies shifted their business from China to Laurus Labs Ltd.
Conference call, November 2018, page 10:
Damayanti Kerai: In the generic part do you think China opportunities are transit in nature or are you seeing some opportunities to come permanently to us?
Dr. Satyanarayana Chava: Permanent to us. The customers are transferring their drug master files to us
On the financial accounting aspect, the company does not capitalize its R&D spending and deducts it as an expense from its income whenever it spends money on R&D. This practice affects the reporting of profits in its financial statements.
Conference call, August 2018, page 12:
Dr. Satyanarayana Chava:…we were unable to demonstrate the growth in profitability quarter-on-quarter because…we do not want to capitalize preoperative expenses. We do not want to capitalize our R&D expenditure on formulations…We did not capitalize in the API also.
The influence of R&D expenses on its profit margins is so much that the company projects that with sales growth, a decline in its R&D spending in the terms of percentage of revenue will lead to an increase in profit margins.
Conference call, January 2022, page 15:
Dr. S Chava:…we invested in R&D much ahead of the business…And if you look at our R&D expenditure remained constant as a number. But as a percentage was pegged on by almost 3.5%-4%…So if you look at 4% came from R&D expenditure…so this is the operational leverage that led us to EBITDA margin expansion.
As per the management, in the recent sharp expansion of profit margins, this operating leverage has contributed about 3%-4% to the profit margins. This is evident from a decline in the R&D expense from 7% of sales in FY2019 to 4% in FY2022 despite an increase in R&D expenditure from ₹166 cr to ₹202 cr during this period.
The company has continued its focus on R&D. Now, it is focusing on developing sterile formulations. It is in the process of setting up an R&D unit for the same.
Conference call, April 2022, page 3:
Dr. Satyanarayana Chava:…we should be ready to commercialize our sterile R&D unit during this quarter, this is being set up at IKP at Shamirpet
Going ahead, an investor should monitor the spending done by the company on R&D to assess whether it is able to maintain its competitive edge.
6) Strong focus on strengthening relationships with existing customers instead of adding new customers:
Laurus Labs Ltd focuses on building stronger relationships with existing customers. It is not in a continuous quest to gain as many new customers as possible.
In FY2019, the company mentioned that in its Oncology division it is focusing on meeting the demand of existing customers by producing new products for them instead of going after new customers and thinly spreading its resources.
Conference call, August 2018, page 24:
Dr. Satyanarayana Chava: We are not adding any new customers, I can tell you. In Oncology we were producing new products to the existing customers and increasing the sales of our existing products.
In FY2022, the company mentioned that one of the reasons it is confident of achieving its target of USD 1 billion in sales by FY2023 is because its customers are extremely happy to buy from it due to its focus on serving existing customers instead of running after new customers.
Conference call, January 2022, page 25:
Dr. S. Chava:…our customers are happy to buy from us because we are not adding new customers, we are increasing sales to our existing customers. So, that is the reason we are still comfortable with that number.
It is a result of this focus on existing customers that the share of revenue of the company from customers who have been with it for more than a decade was more than 65% in FY2019.
Credit rating report, CARE, June 2019, page 1:
customers which have been associated with Laurus for more than a decade accounting for over 65% of the revenue in FY19.
An investor should monitor the share of the revenue from its existing customers to monitor any shift in the strategy of the company of prioritizing existing customers.
Over the years, the tax payout ratio of Laurus Labs Ltd has been significantly lower than the standard corporate tax rate prevalent in India. The key reason for the same is various tax incentives available to the company like exports incentives, profits generated out of special economic zones, incentives on R&D expenses as well as investments done by the company.
Laurus Labs Ltd had highlighted these incentives to investors in its RHP, December 2016, page 479:
Tax Incentives: We are currently availing income tax benefits…for weighted deduction of in-house R&D expenditure…We availed investment allowance…at 15% of actual cost of new plant and machinery…We are also availing export incentives under the Merchandise Export Incentive Scheme (“MEIS”) on our exports and Market Accesses Initiative Reimbursement (“MAI”)
In FY2018, when the govt. reduced the weighted deduction on R&D expense from 200% to 150% and discontinued the investment allowance, then the tax payout by Laurus Labs Ltd increased to 29% from 19% in FY2017.
Conference call, May 2018, page 4:
V.V. Ravi Kumar: This is because of reduction of weight deduction for the R&D expenses from 200% to 150% from FY2018 onwards and also the discontinuation of 32 AC that is for an investment, these two contributed about the 10% increase in the effective tax rate.
FY2018 annual report, page 174:
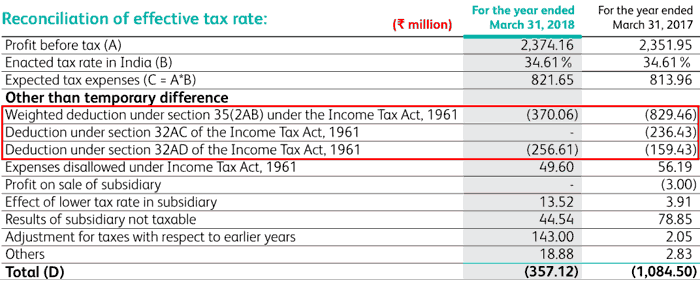
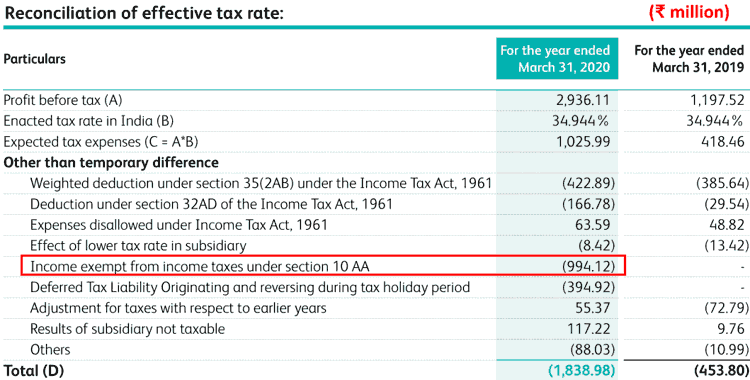
However, from FY2020, production from units 2 and 5 started, which are in special economic zones (SEZ), which get a rebate on income tax under section 10AA.
Conference call, January 2018, page 11:
V.V. Ravi Kumar: Once we get profits from the Unit-5 and Unit-2, these two units are SEZ units, then the tax rate will change. So those profits will be exempted.
As a result, in FY2020, Laurus Labs Ltd got a substantial incentive in income tax and its tax payout ratio declined to 13%.
FY2020 annual report, page 179:
Going ahead, an investor should keep a close watch on the income tax incentive available to Laurus Labs Ltd. This is because tax incentives can have a significant influence on the net profitability of the company and its competitive advantage in tenders as well as its ability to bear pricing pressure.
Advised reading: How to do Financial Analysis of a Company
Operating Efficiency Analysis of Laurus Labs Ltd:
a) Net fixed asset turnover (NFAT) of Laurus Labs Ltd:
Over the years, the NFAT of the company has declined from 3.2 in FY2014 to 2.0 in FY2022. However, during this period, the NFAT of the company has fluctuated significantly. In the initial period of FY2014 to FY2018, the NFAT declined sharply from 3.2 to 1.5.
One reason for this decline was the large capital expenditure of about ₹1,750 cr done by Laurus Labs Ltd during FY2014-FY2018 where it was investing money in expanding capacity for formulations as well as APIs like Dolutegravir and Lamivudine.
However, another important reason for the decline is peculiar to pharmaceutical companies. In the pharma industry even after a manufacturing plant is complete, the company cannot start to sell its products straightaway. First, it has to take approvals from regulatory authorities of its target countries. Even after all the regulatory approvals are in place, the pharma company still cannot sell its products until its customers have approved samples produced from the new plant (called validation batches). The process of approval of sample products i.e. validation may take about 1-1.5 years.
For example, when Laurus Labs Ltd completed the construction of it custom synthesis (CRAMS) unit for Aspen (Unit 5) in November 2016, then it highlighted to its investors that even though the unit is complete, its commercial sales would start only after about 15 months once all the validation batches are completed and approved.
Conference call, February 2017, page 11:
Dr. Satya Chava: The new unit which we inaugurated in November, we started validations. For next 15 months, we expect to finish all the validation batches and then the commercial sales will start.
During the validation period, the manufacturing plants of pharma companies stay as non-productive assets that keep on consuming operating expenses without generating any revenue.
During FY2018 and FY2019 when the NFAT of Laurus Labs Ltd was the lowest at 1.5, it was carrying manufacturing plants of about 800 cr including a large investment in the formulation business, which were ready but not producing any revenue.
Conference call, November 2018, page 5:
V.V. Ravi Kumar: we have taken a conscious call, we have more than INR 800 Crores of assets which are not generating or generating very meager revenue as of today.
From FY2020, the formulation unit started generating revenues and Laurus Labs Ltd.’s sales increased significantly in the coming years. As a result, the NFAT of the company increased to 2.5 in FY2021.
Thereafter, in FY2021 and FY2022, Laurus Labs Ltd again went for a large capital expenditure of more than ₹2,100 cr. Due to the above-mentioned waiting period during approvals and validation, currently, about 25% of the total fixed assets of the company are not generating any revenues.
Conference call, January 2022, page 21:
Dr. S Chava: …25% of our CAPEX is not yielding revenues right now.
Tushar Bohra: 25% of your CAPEX done over FY 2022?
Dr. S Chava: No, no, 25%, our gross block.
Because of the non-revenue generating capital expenditure, the NFAT of the company declined during FY2022 to 2.0 from 2.5 in FY2021.
During this non-revenue generating period of manufacturing units, Laurus Labs Ltd ends up spending money on the operating expenditure of the plant for producing validation batches, which many times adds up to hundreds of crores every year.
For example, during FY2019 when the formulation unit was ready but not generating any revenue, Laurus Labs Ltd was spending about ₹150 cr every year on the formulation segment as operating expenses.
Conference call, November 2018, page 9:
Dr. Satyanarayana Chava: Our formulation, R&D, opex, interest, depreciation, everything is close to INR 150 Crores per year right now.
Therefore, large investments in land, plant & machinery, skilled manpower and the added cost of non-revenue generating approval and validation period make pharmaceutical business, especially API and formulations like Laurus Labs Ltd, very capital-intensive.
As per the company, it is going to spend about ₹2,000-2,500 cr on capital expenditure in FY2023 and FY2024.
Conference call, April 2022, page 9:
Dr. Satyanarayana Chava: That is the kind of CapEx is there in front of us, but for next FY 23 and FY 24 we may stand anywhere between INR 2000 to 2500 crore CapEx.
Going ahead an investor should keep a close watch on the commercialization of new units of Laurus Labs Ltd to understand whether it is able to utilize its assets efficiently.
Further advised reading: Asset Turnover Ratio: A Complete Guide for Investors
b) Inventory turnover ratio (ITR) of Laurus Labs Ltd:
Over the years, the inventory turnover ratio (ITR) of the company has declined from 4.8 in FY2014 to 3.0 in FY2022. As the company has diversified its business from API to formulations, its business has kept on becoming inventory-intensive as reflected in the declining ITR.
Conference call, November 2019, page 5:
V.V. Ravikumar: Formulation is taking an additional inventory of around Rs.100 Crores and the other contract manufacturing opportunities also caused this buildup
Moreover, the company changed its production strategy for ARV formulations. Laurus Labs Ltd decided that it would not change its production plan even if the demand is lower, which also seems to have contributed to a higher inventory, especially in ARVs.
Conference call, November 2019, page 8:
Dr. Satyanarayana Chava:…we are not changing our production plans based on the demand, we fairly have a stable production plan in place for the last three months and in the next six months also.
Conference call, October 2021, page 7:
Dr. S. Chava:…we have built significant inventory, you might have seen our inventory also gone up by close to Rs.300 crores, that is primarily because we are having a lot of ARV inventory
As per the company, the increasing requirement for inventory would continue in the future.
Conference call, October 2020, page 8:
V V Ravi Kumar: And when we moved towards formulations where most of our formulations are backward integrated with APIs, so, we need to maintain these kind of inventory levels.
The credit rating agency, CARE has also highlighted the large inventory requirements of the business of Laurus Labs Ltd.
Credit rating report, CARE, June 2020, page 3:
Laurus has high inventory holding period as the company has to maintain buffer stock for validation of new products. Furthermore, in FY22, the inventory holding is relatively on a higher side due to higher work-in-progress (WIP) inventory and finished stock inventory.
Over the last 10 years, FY2013-FY2022, Laurus Labs Ltd has witnessed its inventory consume about ₹1,600 cr of additional capital as its inventory increased from ₹156 cr in FY2013 to ₹1,760 cr in FY2022.
Going ahead, an investor should keep a close watch on the ITR of the company to assess whether it is using its inventory efficiently.
Further advised reading: Inventory Turnover Ratio: A Complete Guide
c) Analysis of receivables days of Laurus Labs Ltd:
Over the years, receivables days of Laurus Labs Ltd have deteriorated from 55 days in FY2014 to 98 days in FY2022.
One of the reasons for increasing receivables days is the longer credit period up to 120 days the company has to give to its customers.
Conference call, May 2017, page 8:
V.V. Ravi Kumar: Some of the customers we have 120-days credit period. That is the reason receivables are at that level
The credit rating agency, CARE also highlighted in its report for Laurus Lab Ltd in July 2017 that it has to give an elongated credit period to its prime customers, which has led to delayed payment collections.
high collection period due to change in proportion of sales mix to customers and extended credit period to prime customers
Over the last 10 years, FY2013-FY2022, Laurus Labs Ltd has witnessed its receivables consume about ₹1,200 cr of additional capital as its trade receivables increased from ₹157 cr in FY2013 to ₹1,354 cr in FY2022.
Going ahead, an investor should monitor the trend of receivables days of Laurus Labs Ltd to assess whether it is able to bring them down to the levels of 55 days, which it used to have in FY2013.
Further advised reading: Receivable Days: A Complete Guide
When an investor compares the cumulative net profit after tax (cPAT) and cumulative cash flow from operations (cCFO) of Laurus Labs Ltd for FY2013-2022, then she notices that over the years (FY2013-FY2022), the company is able to convert its profit into cash flow from operations.
Over FY2013-22, Laurus Labs Ltd reported a total net profit after tax (cPAT) of ₹2,906 cr. During the same period, it reported cumulative cash flow from operations (cCFO) of ₹3,290 cr.
It is advised that investors should read the article on CFO calculation, which would help them understand the situations in which companies tend to have the CFO lower than their PAT. In addition, the investors would also understand the situations when the companies would have their CFO higher than the PAT.
Further advised reading: Understanding Cash Flow from Operations (CFO)
Learning from the article on CFO will indicate to an investor that despite a significant amount of money being stuck in inventory and receivables, the cCFO of Laurus Labs Ltd is higher than the cPAT primarily due to the following factors:
- Depreciation expense of ₹1,240 cr (a non-cash expense) over FY2013-FY2022, which is deducted while calculating PAT but is added back while calculating CFO.
- Interest expense of ₹850 cr (a non-operating expense) over FY2013-FY2022, which is deducted while calculating PAT but is added back while calculating CFO.
The Margin of Safety in the Business of Laurus Labs Ltd:
a) Self-Sustainable Growth Rate (SSGR):
Read: Self Sustainable Growth Rate: a measure of Inherent Growth Potential of a Company
Upon reading the SSGR article, an investor would appreciate that if a company is growing at a rate equal to or less than the SSGR and it can convert its profits into cash flow from operations, then it would be able to fund its growth from its internal resources without the need of external sources of funds.
Conversely, if any company attempts to grow its sales at a rate higher than its SSGR, then its internal resources would not be sufficient to fund its growth aspirations. As a result, the company would have to rely on additional sources of funds like debt or equity dilution to meet the cash requirements to generate its target growth.
An investor may calculate the SSGR using the following formula:
SSGR = NFAT * NPM * (1-DPR) – Dep
Where,
- SSGR = Self Sustainable Growth Rate in %
- Dep = Depreciation rate as a % of net fixed assets
- NFAT = Net fixed asset turnover (Sales/average net fixed assets over the year)
- NPM = Net profit margin as % of sales
- DPR = Dividend paid as % of net profit after tax
(For systematic algebraic calculation of SSGR formula: Click Here)
While analysing the SSGR of Laurus Labs Ltd, an investor would notice that over the years, the company had an SSGR in the single digits. It is only recently in FY2022 that its SSGR improved to 18% in FY2022 due to a sharp increase in its profit margins due to a higher contribution from formulations and synthesis businesses.
Therefore, an investor is looking at a situation, where over most of the last 10 years, the SSGR of Laurus Labs Ltd has been in the single digits whereas, over the same period, the company has grown its sales at a CAGR of about 24%.
As the company has grown its sales more than its SSGR; therefore, it is not able to grow its business using its internally generated cash flow. As a result, to grow its sales from ₹719 cr in FY2013 to ₹4,936 cr in FY2022, the company has to raise additional capital in the form of incremental debt and multiple rounds of equity dilution.
Over the last 10 years (FY2013-FY2022), the company has raised an additional debt of ₹1,485 cr as its total debt has increased from ₹292 cr in FY2013 to ₹1,777 cr in FY2022 (1,485 = 1,777 – 292).
Over and above the debt, in the last 10 years, Laurus Labs Ltd has diluted its equity two times for meeting its capital expenditure requirements. It raised a total of about ₹600 cr during the last 10 years (FY2013-FY2022).
- December 2016: IPO: ₹300 cr (FY2017 annual report, page 51)
- October 2014: ₹300 cr from Warburg Pincus (Credit rating report by CARE, August 2015, page 1)
These are not the only occasions when Laurus Labs Ltd had to dilute its equity to meet its funds’ requirements.
In the past, in 2012, Fidelity and promoters had invested ₹60 cr in the company (FY2014 annual report, page 18) and in 2007, Aptuit group had invested ₹102 cr in the company.
The company was in such urgent need of funds for growth that it committed to a minimum return of 18% on the equity investments done by Fidelity and Warburg Pincus (Bluewater).
FY2015 annual report, page 108:
In case of winding up or liquidation, if the liquidation proceeds are adequate to cater to the amount of investment of Bluewater and Fidelity as increased by an Internal Rate of Return (IRR) of 18% per annum computed thereon from the date of investment by each of them, then the liquidation proceeds will be shared equally among all the shareholders
Advised Reading: How to study the Annual Report of a Company
In the IPO, the company paid about 4.21% of raised money as issue expenses (RHP, December 2016, page 103) i.e. out of ₹300 cr raised by the company in the IPO, it got only about ₹287.5 cr because about ₹12.5 cr was spent as the cost of IPO, merchant bankers, underwriters etc.
Therefore, an investor would note that the capital-intensive nature of the business and the desire of the promoters to grow the company at a very fast pace beyond what its inherent cash flow can sustain has led to multiple rounds of equity dilution. At the time of IPO, the majority stake in the company was held by private equity companies (58.14%).
An investor arrives at a similar conclusion when she analyses the free cash flow (FCF) position of Laurus Labs Ltd.
b) Free Cash Flow (FCF) Analysis of Laurus Labs Ltd:
While looking at the cash flow performance of Laurus Labs Ltd, an investor notices that during FY2013-FY2022, it generated cash flow from operations of ₹3,290 cr. During the same period, it did a capital expenditure of about ₹4,378 cr.
Therefore, during this period (FY2013-FY2022), Laurus Labs Ltd had a negative free cash flow (FCF) of (₹1,088) cr (=3,290 – 4,378).
In addition, during this period, the company had a non-operating income of ₹170 cr and an interest expense of ₹850 cr. As a result, the company had a total negative free cash flow of (₹1,768) cr (= -1,088 + 150 – 850). Please note that any capitalized interest is already factored in as a part of the capex deducted earlier.
As discussed earlier, Laurus Labs Ltd has used incremental debt of about ₹1,485 cr and equity infusion from Warburg Pincus in FY2015 and IPO in FY2017 to raise funds to meet this negative free cash flow.
Going ahead, an investor should keep a close watch on the free cash flow generation by Laurus Labs Ltd to understand whether the company continues to consume cash from outside sources or it starts to generate surplus cash from its business.
Further advised reading: Free Cash Flow: A Complete Guide to Understanding FCF
Self-Sustainable Growth Rate (SSGR) and free cash flow (FCF) are the main pillars of assessing the margin of safety in the business model of any company.
Further advised reading: 3 Simple Ways to Assess “Margin of Safety”: The Cornerstone of Stock Investing
Additional aspects of Laurus Labs Ltd:
On analysing Laurus Labs Ltd and after reading annual reports, RHP, its credit rating reports and other public documents, an investor comes across certain other aspects of the company, which are important for any investor to know while making an investment decision.
1) Management Succession of Laurus Labs Ltd:
Laurus Labs Ltd is promoted by some professionals led by Dr Satyanarayana Chava, ED & CEO (current age 61 years) and Mr V. V. Ravi Kumar, ED & CFO (current age 57 years) who are experienced in the pharma industry having worked for companies like Ranbaxy and Matrix Laboratories.
Until February 27, 2020, Mr C. Chandrakanth, Son-in-Law of Dr. C. Satyanarayana used to be one of the Executive Directors on the board of Laurus Labs Ltd, which indicated a succession plan. However, he resigned as executive director on February 27, 2020, and continues as a non-executive director on the board of directors.
Mr C. Krishna Chaitanya, son of Dr. C. Satyanarayana (current age 32 years) is working with the company as an Executive Vice President and Head of Synthesis and Ingredients business. He is taking a remuneration of ₹1.11 cr indicating active employment with the company (FY2022 annual report, pages 193-194).
Moreover, in FY2020, one of the founder promoters, Dr Srihari Raju Kalidindi got himself removed from the “Promoters” of the company and is now classified as a “Public” shareholder. He also sold some of his shares in the company in FY2020. It may be a part of the settlement among the founder promoters about the succession planning of the company.
Moreover, the presence of the next generation of Dr Satyanarayana Chava in the company in an active role when the founder-promoters are still handling active responsibilities indicates a good succession plan. It allows the next generation to learn the nuances of the business under the guidance of senior members who are still actively involved in the business.
An investor may contact the company directly to understand the reasons for the resignation of Mr C. Chandrakanth, Son-in-Law of Dr. C. Satyanarayana from the position of executive director. Is it a part of the ownership succession plan of the promoters that the son of the promoter would continue to lead Laurus Labs Ltd going ahead and the son-in-law has to look for a separate career?
An investor should look for signs of any ownership-related differences between the promoter family members of the company.
Further advised reading: How to do Management Analysis of Companies?
2) Project execution by Laurus Labs Ltd:
Over the years, the company has executed some large manufacturing projects involving units dedicated to API, formulations and synthesis divisions. Over FY2013-FY2022, Laurus Labs Ltd has executed a capital expenditure of about ₹4,378 cr.
In many cases, the company was able to complete the project within expected timelines. For example, in the FY2015 annual report, the company stated that its formulation plant (Unit 2) in Vishakhapatnam would be operational by December 2015.
FY2015 annual report, page 38:
Construction of formulation manufacturing facility in Atchutapuram, Visakhapatnam, which will be operational from December 2015
As per the FY2016 annual report, Unit 2 was completed and opened for regulatory inspection in December 2015 by the company.
FY2016 annual report, page 19:
New formulation facility (Unit 2) was inspected by German authorities in December 2015 and approval obtained in March 2016
However, it is not that it could complete the entire project within time limits. At times, it had faced some delays. For example, in FY2020, its production of Oncology APIs suffered when it could not complete its backward integration of intermediates in time.
Conference call, January 2020, page 3:
Dr. Satyanarayana Chava: In the first year, we were unable to ramp up production of one of our key ONCO API because of backward integration which did not get complete on-time.
Subsequently, the company could not complete its debottlenecking exercise to increase its formulation capacity.
Conference call, January 2021, page 3:
Dr. Satyanarayana Chava: Our debottlenecking exercise of existing capacities is on course and this capacity will be available for commercial manufacturing by end of the Q4, although with a delay of a few months.
Similarly, while executing the expansion of fermentation capacity of Laurus Bio Pvt. Ltd, it faced delays in meeting the stipulated timeline.
Conference call, January 2022, page 6:
Dr. S. Chava: During the quarter, Laurus Bio commissioned two more fermenters of 45KL each taking to total capacity of 180KL. There was a few months’ delay in qualifying the fermenters.
Going ahead, an investor should keep a close watch on the progress of capital expansion projects of the company. This is because delays in the project execution can lead to cost overruns that may affect the production plans of the company and may lead to loss of business opportunities.
3) Dividends funded by debt:
The company started paying dividends in FY2016 and has paid out a total dividend of ₹292 cr excluding dividend distribution tax (DDT) during FY2016-FY2022. During this period, the company had a negative free cash flow of ₹535 cr (FY2016-FY2022). This is because, during FY2016-FY2022, it generated a total cash flow from operations (CFO) of ₹3,136 cr whereas it made a capital expenditure of ₹3,681 cr.

Therefore, it consumed its entire CFO during FY2016-FY2022 for making capital expenditure and still was short of funds (negative free cash flow). As a result, it had to raise funds from additional sources like equity (IPO for ₹300 cr) and incremental debt of ₹749 cr (FY2016 debt: ₹1,028 cr and FY2022 debt: ₹1,777 cr).
If a company has a negative free cash flow and is using debt and equity dilution to meet its capital expenditure, then if it payout out dividends to its shareholders, then the dividends are funded by debt. This is because money is a fungible commodity.
We believe that companies should use their resources for capital expenditure and if any surplus is left then should repay debt. In the situation of deficit (i.e. negative free cash flow), the companies should raise only that much debt, which is needed to meet its business requirements and avoid raising extra debt in order to enable it to pay dividends. Such dividend outflows put an extra burden of interest payments on the company, which could have been avoided.
Further advised reading: Steps to Assess Management Quality before Buying Stocks
4) Lifecycle of drugs and therapies:
Over the years, therapies for diseases keep on changing and older drugs make way for newer and more efficient drugs. Therefore, the market for older drugs undergoes significant change. Such transitions present substantial challenges to the pharmaceutical players.
In the last 10 years, Laurus Labs Ltd has seen such changes in two of its key therapy segments.
4.1) ARV/HIV drug therapy:
In the early 2000s, treatment regimens for ARV/HIV saw major developments. The drugs became cheap and widely available. Multiple governments and international donor organizations started providing funding for HIV treatment. The world’s focus was on detecting as many patients suffering from HIV and treating them.
Therefore, a huge market for ARV drugs was created and Laurus Labs Ltd captured a very big share of such market. Laurus Labs Ltd focused on the API market for ARV/HIV drugs because, in this segment, access to the API manufacturing capacity was the success-determining factor for the players.
Conference call, November 2017, page 12:
Dr. Satyanarayana Chava: The biggest challenge in ARV therapy is not formulation capacity. The biggest challenge comes from the API capacity. If you look at 20 million patients, everybody takes one pill a day, they need 7 billion tablets. Many companies in India have that capacity, but to treat 20 million patients assuming everybody takes a gram they need roughly 20,000 tonnes of API. That everybody may not be able to make. So the challenge here is API and not the formulation.
Here an investor may note that it is not that for all the drugs, API capacity is the limiting factor. In fact, for another drug made by the company, Pregabalin, the formulation capacity is the challenging factor.
Conference call, May 2019, page 10:
C Srihari: Is it a complex product in the sense that it could be a problem for some of the players to crack?
Dr. Satyanarayana Chava: It is not that way, the problem is, it more into how much of FDF capacity allocation will people do to take the market share, is more into FDF capacity rather than API complexity.
Therefore, determining the crucial constraining step in the supply chain of the drug and then creating manufacturing capacities for that step helps pharmaceutical companies gain a large market share.
By creating large ARV API capacities, Laurus Labs Ltd dominated the market for many APIs for ARV drug regimens. By FY2021, the company was supplying to almost 80% of companies participating in the HIV drug tenders.
FY2021 annual report, page 48:
At present, Laurus is supplying to 80% of the players who participate in ARV tenders.
Moreover, Laurus Labs Ltd also benefited from the fact that companies are not able to change their ARV API suppliers at a short notice. Whenever any company wishes to change its ARV API supplier, it takes about 12-14 months for a complete switch to the new supplier. It makes the supplier-switching costs high in the ARV API segment.
Conference call, January 2020, page 9:
Dr. Satyanarayana Chava:…in this business if someone wants to move their APIs to a new manufacturer it takes anywhere between 12 to 14 months,
However, as the HIV treatment programs matured, the number of undetected HIV patients who could be provided with the treatment started declining steadily. The below chart from the FY2022 annual report, page 45 shows a consistent decline in the detection of new HIV infections over the last 10 years (2011-2021).
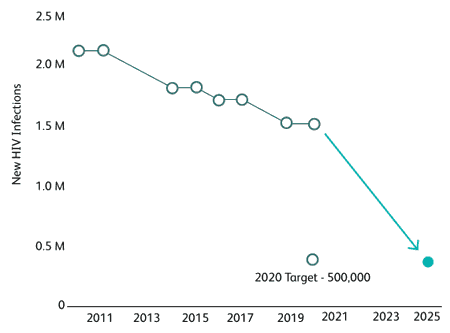
As a result, the growth of the market for HIV drugs is slowing down year after year. In FY2019, Laurus Labs Ltd believed that the growth of the HIV drugs market would completely stop by 2023. Thereafter, the only way to grow would be to take away market share from other players.
Conference call, May 2018, page 19:
Dr. Satyanarayana Chava: Overall market will grow until 2023 with respect to the enrollment of patients after that we need to get more market share.
In FY2021, the company acknowledged that the pace of growth in the ARV segment is expected to be low. Moreover, any benefit from the growth in the number of new patients would be reduced by the decline in the prices of ARV drugs.
Conference call, January 2021, page 8:
Dr. Satyanarayana Chava: I think doubling is impossible….6%, 7% of patient additions we are seeing based on the data. So the growth could be 5%, 6% in offtake. We do believe that increase will be offset by price decline over a period of time.
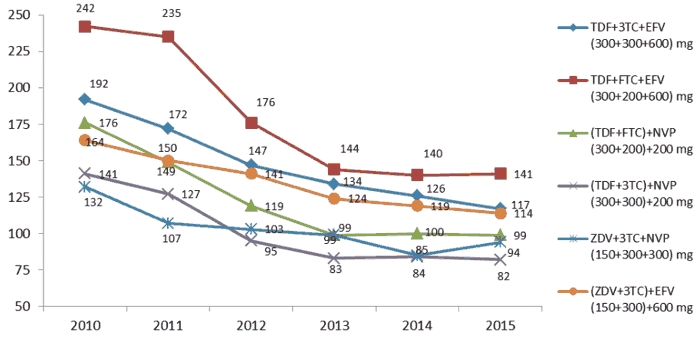
As the prevalent drug therapies mature and the technology for producing them becomes more efficient and widely available, then their prices start to decline. This price decline of the drugs further shrinks their market.
The following chart from the RHP of Laurus Labs Ltd, December 2016, page 127 shows a consistent decline in the cost of ARV regimens in USD per-patient-per-year from 2010 to 2015.
Since then, the prices of ARV drugs have continued to decline and Laurus Labs Ltd had faced its impact on the business. In FY2022, the prices of ARV APIs, as well as formulation, declined by 10%. The company intimated to its shareholders that there is a very low probability that the prices will increase in future and this might be the new price level.
Conference call, April 2022, pages 4 and 5:
Dr. Satyanarayana Chava: API prices and ARV prices both were down, around 10%…we don’t foresee the API prices and formulary prices going up, I think this could be the new base.
Moreover, as discussed earlier, the drug regimen of HIV treatment shifted from Efavirenz-based therapies to Dolutegravir-based therapies. This resulted in a decline in the sale of Efavirenz API where Laurus Labs Ltd used to own about 50% of the global market share.
Conference call, November 2019, page 9:
Dr. Satyanarayana Chava: The main capacity where we are not utilizing is Efavirenz where we have 70 tonne capacity we are utilizing half of it right now
However, being the largest player in Efavirenz with the lowest cost of production, the company was still able to gain market share in the declining market.
Conference call, July 2020, page 10:
Dr. Satyanarayana Chava:…Efavirenz demand came down globally by 60%, but our revenue drop in Efavirenz is not 60%. That means we were gaining market share of Efavirenz even though volumes are going down.
In addition to the declining global demand for one of its largest ARV APIs, the company had limited its target market on its own by deciding that it would not participate in the HIV drug tenders in India.
Conference call, January 2020, page 22:
Dr. Satyanarayana Chava: We are not intending to participate in the NACO Indian government tenders.
As a result, soon the company realized that the probably ARV drug segment is past its best days and it needs to reduce its focus from the ARV segment and focus more on the non-ARV segment, which also offers better profit margins.
Conference call, January 2022, page 16:
Dr. S Chava: So non ARV business, synthesis business, formulation business, other API business are more profitable, more gross margin business than ARV business.
Therefore, when Laurus Labs Ltd planned an expansion in its formulation capacity, then it decided to dedicate it to non-ARV business.
Conference call, July 2022, page 18:
Dr. Satyanarayana Chava: And we expect about 4 billion tablets capacity. That additional capacity which will come next year will be primarily used for non-ARVs, nothing will be used for the ARVs there.
Therefore, it seems that the ARV business segment is past its prime. Laurus Labs Ltd has already earned a substantial part of possible profits possible from this business. Going ahead, earning humongous profits from the ARV business would be tough; therefore, the company has decided to focus more on other segments.
Advised reading: How to do Business Analysis of Pharmaceutical Companies
4.2) Hepatitis-C segment:
Similar to the ARV segment, Laurus Labs Ltd faced circumstances where after initial good results, the Hepatitis-C drug segment stopped making significant profits for the company and it had to divert its focus away from Hepatitis-C drugs.
In 2015, Laurus Labs Ltd entered into the Hepatitis-C segment when it licensed drugs from Gilead and entered into a contract with Natco Pharma, the Hepatitis-C drugs market leader in India to supply APIs.
Immediately after introduction, the Hepatitis-C segment showed very good business performance. It contributed significantly to the improvement of the overall business performance of Laurus Labs Ltd.
FY2016 annual report, page 6:
Introduction of Hepatitis C franchise brought significant business growth
However, within a couple of years, the company started facing pricing pressure in this segment.
Conference call, November 2017, page 2:
Dr. Satyanarayana Chava: The outlook for Hep C. franchise remains challenging, although we have seen improvements in volumes. However, we have seen significant pricing pressures as we understood from our partner
One of the reasons for intense competition and pricing pressure in the Hepatitis-C segment was the lack of strict regulations. Unlike ARV, in Hepatitis-C, pharma companies could get APIs from non-approved sources as well, which increased the competition significantly.
Conference call, August 2019, page 8:
Dr. Satyanarayana Chava: Here in the Hep C front, there are multiple reasons, one is this market is not regulated in a sense…Whereas in Hep C people can till launch in India by buying API from China from non-approved sources as well, so the competition is very high
The company faced another source of pricing when Govt. of India put pricing controls on Hepatitis-C drugs by including them in Drug Price Control Order (DPCO)
Conference call, January 2018, page 2:
Dr. Satya: We have seen significant pricing pressure in the API as well as in the Formulations, and also please note that actually some of HEP-C formulations came under DPCO.
Moreover, another factor that limited the market size of Hepatitis-C was that it was a time-bound therapy where a patient needed to take drugs only for about a 90-days period. It is unlike ARV/HIV where the patient has to take drugs for her entire life.
Conference call, August 2019, page 9:
Dr. Satyanarayana Chava:…major Hep C companies globally like Gilead and all, their revenues in Hep C are also going down because patient pool is coming down. It is not like ARV a patient is on and he will be on for life whereas Hep C the patient moves out of the treatment within 90 days
Therefore, due to price control by Govt. as well as the declining patient pool, the Hepatitis-C segment of Laurus Labs Ltd saw a significant decline in sales. In FY2019, the segment saw about a 29% decline in sales.
Credit rating report, CARE, June 2019, page 2:
Improvement in the revenue from the aforementioned segments was partially offset by decline in the revenue from the Hepatitis C segment by around 29% during FY19.
Therefore, in FY2020, Laurus Labs Ltd reduced its focus on the Hepatitis-C segment and even removed reporting its performance as a separate segment.
Conference call, November 2019, page 3:
Dr. Satyanarayana Chava: We believe this is the new norm for Hep C business and the way forward we would like to add Hep C into Other API segment for reporting because this segment became not very significant for us.
Therefore, within a period of 5-years, from FY2016 to FY2020, the Hepatitis-C segment went from a star performer to a poor performer and completed its lifecycle. As a result, Laurus Labs Ltd had to focus on other business segments despite controlling about 40% of the Indian market share of Hepatitis-C via its agreement with Natco Pharma.
Therefore, an investor should note that all drug therapies have a lifecycle. Over time, old therapies give way to newer, more efficient therapies. In such situations, existing players despite having a large market share have to make adjustments to their business model. For Laurus Labs Ltd, an investor should always keep this in her mind that in future, its product profile, which might be very attractive now, would change. At that time, she would need to focus on whether the company is able to bring in newer therapies with good business potential.
As of now, Laurus Labs Ltd is looking forward to growing significantly in the diabetic and cardiovascular segments.
Conference call, July 2021, page 9:
Dr. Satyanarayana Chava: Our focus in other therapy areas, especially is on anti-diabetes segment and cardiovascular…we have a full basket of products in the diabetic segment. So there we have created capacity for both APIs and formulations. And when it comes to the cardiovascular segment…we invested during this crisis to enhance capacity and the best quality product, and we do see the opportunities for a fully integrated player in both cardiovascular as well as a diabetic segment, because these are large volume products, and the capacity demands are also high, quality demands are also equally high.
Due to their very large market size, both segments, diabetes as well as cardiovascular, are targeted by the largest pharmaceutical companies from all countries. Here, Laurus Labs Ltd would have to compete with players who are much bigger in size as well as resources.
Laurus Labs Ltd started commercial sales of one of the anti-diabetic drugs, Metformin, in July-Sept. 2018.
Conference call, August 2018, page 3:
Dr. Satyanarayana Chava: we started commercial sales of Metformin API from Q2FY19 from unit 2 from this quarter
To increase its focus on the diabetes segment in the US, Laurus Labs Ltd took back the ANDA from its partner so that it could drive its own business strategy in the US market.
Conference call, February 2019, page 14:
Dr. Satyanarayana Chava:…some products we took back like Metformin, HCQ when we filed it was a partnered product, now they are transferring ANDA to us
However, after one year of sustained efforts, Laurus Labs Ltd could gain only a very small market share for Metformin.
Conference call, January 2020, page 22:
Dr. Satyanarayana Chava: Metformin we have very small market share.
An investor should note that despite full focus, Laurus Labs Ltd could not achieve a significant breakthrough in the anti-diabetic segment.
Therefore, she should keep a close watch on the performance of the company in the large business segments like diabetes and cardiovascular to understand whether the company is able to achieve its aim of being a global leader in many of its products.
Conference call, October 2020, page 22:
Dr. Satyanarayana Chava: We have 25% more market share in seven APIs that we make, and we want to expand that number to 15 APIs where we would like to have 25% or more global market share in the next three years.
Moreover, the company has also increased its efforts to directly enter developed markets like the USA. In FY2019, it made changes in its partnership with Dr Reddy’s and Rising Pharma. Previously, it planned to enter into the US market by collaboration where it would produce the drugs and its partners would file the ANDA etc. and market it.
However, in FY2019, it took 5 products back from its partners out of the total agreement of 11 drugs so that it can enter the USA market with these products on its own. In the process, it had to reimburse the expenses of about ₹4.5 cr done by its partners on these 5 products.
Conference call, November 2018, page 4:
V.V. Ravi Kumar:…we have renegotiated the FDF contract with Rising Pharma and Dr. Reddy for about five products whatever we have filed before now those five products were taken back…So we have returned them those expenses
It remains to be seen whether the company would be able to make a big impact from its direct formulation sales to the US market. An investor should continuously monitor its performance in the US market.
5) Related party transactions of Laurus Labs Ltd with its promoters:
In the past, on many occasions, Laurus Labs Ltd had entered into transactions with its promoters. However, an investor should focus on some of these transactions.
5.1) Laurus Labs Ltd took guesthouses on lease from promoters:
In its RHP, Laurus Labs Ltd disclosed that it has taken three guesthouses on lease from promoters. Out of these, two properties were leased by Ms Soumya who is the daughter of founder promoter, Dr. Satyanarayana Chava.
RHP, December 2016, page 222:
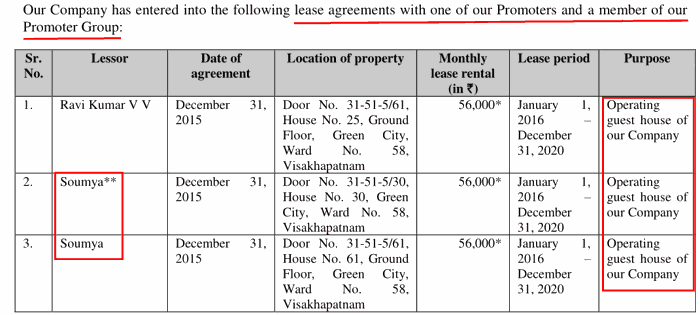
The company was paying a monthly lease rent of ₹56,000 for each of these properties to the promoters.
In the case of one of the properties, Ms Soumya, the daughter of Dr. Satyanarayana Chava did not own the property herself. In fact, she has in turn taken it on lease from Ms Naga Rani Chava who is the wife of Dr. Satyanarayana Chava, at a monthly rent of ₹47,520.
RHP, December 2016, page 222:
Pursuant to sub-lease agreement dated December 31, 2015 executed between Soumya and our Company, Soumya has leased the said property from one of our Promoters, Naga Rani Chava as per lease deed dated December 31, 2015 for a monthly lease rental of ₹47,520
Therefore, it seems like a case where the promoters are providing their properties, which they have taken on rent at a lower cost, to the company at a higher rent to make a profit. As an alternative, Laurus Lab Ltd could have directly entered into the lease agreement with the ultimate owner of the property and it would have saved money for the company and the shareholders.
Further advised reading: How Promoters benefit from Related Party Transactions
5.2) Promoters’ remuneration:
Promoters of Laurus Labs Ltd have been drawing significant remuneration from the company. In FY2022, the founder-promoter, Dr. Satyanarayana Chava took home a total remuneration of about ₹27.5 cr (FY2022 annual report, page 65).
It is appropriate for promoters to take a reasonable salary when the business performance of the company is improving. However, an investor notices that during FY2019 when the profit margins of the company had declined significantly, still the promoters drew a significant salary and in addition, Mr Chandrakanth Chereddi, son-in-law of the founder promoter, Dr. Satyanarayana Chava received a significant increase in salary.
In FY2019, the company reported the lowest operating profit margin in the last decade at 16%, down from 20% in FY2018. In the same year, the net profit margin halved to 4% from 8% in FY2018. The net profit after tax (PAT) for the company in FY2019 was ₹94 cr.
In FY2019, the founder promoter, Dr. Satyanarayana Chava took home a remuneration of ₹12.4 cr, which is about 13% of PAT (FY2019 annual report, page 72). In addition, in FY2019, Mr Chandrakanth Chereddi, son-in-law of the founder promoter, Dr. Satyanarayana Chava received an increment of 18% (FY2019 annual report, page 74).
In FY2021, the remuneration proposed to be paid by Laurus Labs Ltd to its promoters exceeded the approved limits.
FY2021 annual report, page 99:
Company subject to shareholders’ approval made provision for payment of managerial remuneration to three executive directors in excess of the approvals obtained earlier under section 197 read with Schedule V to the Companies Act, 2013 aggregating INR 7.48 crores for the year ended March 31, 2021.
Going ahead, an investor should keep a close watch on the remuneration taken by the promoters of the company.
Further advised reading: How to identify Promoters extracting Money via High Salaries
5.3) Sale of information technology division by Laurus Labs Ltd to the promoters:
In FY2009, the company got a software division when apparently a software company owned by Aptuit group was merged with the company.
FY2014 annual report, page 66:
during the year ended March 31, 2009, 88,690 CCPCPS had been issued as part of the scheme of amalgamation of Aptuit Informatics India Private Limited.
An investor would notice that Aptuit group was the first investor who had invested ₹102 cr in the company in 2007. At that time, the name of the company was also changed to Aptuit Laurus Limited (RHP, December 2016, page 41).
It seems that as a part of its overall agenda, the Aptuit group merged a software entity, Aptuit Informatics India Private Limited into the company.
In FY2014, the company sold the software/information technology division to Laurus Infosystems (India) Private Limited (LIIPL), which was owned by the promoter, Dr. Satyanarayana Chava (80.6%) and his wife, Ms Naga Rani Chava (19.4%) (RHP, December 2016, page 225).
Our Promoters, Dr. Satyanarayana Chava and Naga Rani Chava hold 3,115,992 and 750,000 equity shares…constituting 80.60% and 19.40%, respectively, of the issued and paid up share capital of LIIPL.
The sale consideration received by the company for this sale was ₹3.25 cr whereas the software division had net assets of ₹2.75 cr and was earning revenue of ₹11.7 cr (FY2014 annual report, page 74).
FY2014 annual report, page 81:
the informatics division…was sold on 28 February, 2014 to Laurus Infosystems (India) Private Limited , a related party…for a total consideration of ₹32.50 Mn., received by way of cash…the net asset value of the division in the Company’s books amounting to ₹27.50 million
Therefore, the software division was sold by the company to its promoters at a price-to-sales ratio of 0.27 (=3.25 / 11.7). In addition, it is not clear whether the net assets of the software division of ₹2.75 cr had any fixed asset as a land parcel or a building, which might be valued on a historical cost basis and the current market value, might be different. Therefore, an investor may do her own due diligence in this transaction.
An investor should be cautious while analysing transactions between the company and its promoters because; such transactions provide opportunities for shifting economic benefits from minority shareholders to promoters if the assets are sold at a price less than their fair market value.
Moreover, in recent years, the promoters have formed a few new entities like Kapston Facilities Management limited, Sterotherapeutics, LLC and NSN Investments etc., which have started transacting with Laurus Labs Ltd in relation to facility maintenance, rent, sale of goods etc. (FY2022 annual report, page 194).
6) Promoters’ personal investments in Immuno-ACT:
In FY2022, Laurus Lab Ltd decided to invest about ₹46 cr in Immunoadoptive Cell Therapy Private Limited (ICTPL) for a 26.62% stake. Out of the said amount, it paid ₹27.6 cr in FY2022 and received an 18.94% stake in ICTPL.
FY2022 annual report, page 50:
Company has acquired 26.62% of stake in Immunoadoptive Cell Therapy Private Limited on fully diluted basis, with around ₹46 crore investment, and has paid the subscription amount of ₹27.60 crore (Rupees Twenty-Seven crore and Sixty lakh only) as “Tranche 1 Subscription Amount”
FY2022 annual report, page 52:
The Company has so far contributed a 1st tranche investment amount of ₹27.60 crore and has got 18.94% voting rights as on date and upon payment of balance amount as per Shareholders’ Agreement, your Company’s voting rights will go up to 26.62%.
An investor notices that at the same time, the promoters of the company have invested in ICTPL in their personal capacities as well.
FY2022 annual report, page 51:
The promoters of your Company, namely Dr. Satyanarayana Chava, Mr. V. V. Ravi Kumar and Dr. Lakshmana Rao C V have also invested in this company in their personal capacity as well.
An investor should be cautious while analysing such transactions where a company invests in an asset and the promoters also invest in their personal capacity. This is because; such transactions open a door for numerous channels where the promoters may benefit at the cost of the company and its minority shareholders.
Such situations represent typical principal and agency issues. For example, if the deal involves selling a stake at a higher cost to the company so that the promoters can get a lower cost for their stake, then it would not be in the favour of the company or its minority shareholders.
This is not to state that such considerations would have taken place in the investments in ICTPL; however, such transactions leave room for unscrupulous promoters to shift economic benefits from the company to themselves. Therefore, an investor should be cautious when she comes across such transactions involving combined investments by the company and the promoters in their personal capacity.
Advised reading: Why Management Assessment is the Most Critical Factor in Stock Investing?
7) Promoters of Laurus Lab Ltd invested money in the company in 2012 and booked profits by selling it to a PE investor in 2014:
In 2012, the promoters of the company along with Fidelity invested about ₹60 cr in the company.
FY2014 annual report, page 18:
2012: Fidelity and the promoter invested ₹600 million in the Company
As per the RHP of the company, page 42, Fidelity had put in its money at a cost of about ₹60-63 per share (adjusted for bonus). Therefore, an investor may assume that the promoters of the company would also have invested at a similar valuation.
Thereafter, when in 2014, Warburg Pincus invested ₹300 cr in Laurus Lab Ltd via its entity, Bluewater, then it also purchased shares from existing investors including private equity players as well as the investors.
Credit rating report, August 2015, page 1:
During October 2014, Warburg Pincus through its affiliate Bluewater Investment Ltd. invested Rs 300 crore in the company to meet growth requirements. Warburg Pincus has also acquired part stakes held by Fidelity and a few other promoter associates
As per the RHP, December 2016, page 42, the average cost of acquisition of shares for Warburg Pincus (Bluewater) was ₹181.62 (adjusted for the bonus issue before IPO). Therefore, an investor may assume that Warburg Pincus would have acquired shares from Fidelity and promoters at a similar price.
As per the FY2015 annual report, page 47, the promoters had sold almost 700,000 shares in the year, which is pre-bonus. Before the IPO, in July 2016, the company had allotted 3 bonus shares for every one held. Therefore, overall, the sale from promoters involved 2,800,000 post-bonus shares at an approximate price of ₹181.62, for about a total consideration of ₹50.8 cr (=2,800,000 * 181.62).
Therefore, it looked like a situation where promoters capitalized on the available opportunity and cashed in on their investment in the company even though the promoters’ stake in the company was low at about 17% (FY2015 annual report, page 47).
Further advised reading: How to know if Promoters are Losing Commitment to the Company
8) Investment by the company in Viziphar Biosciences Private Limited:
As per the FY2014 annual report, page 19, during the year, Laurus Lab Ltd acquired a 100% stake in Viziphar Biosciences Pvt Ltd (VBPL).
An investor notices that for this acquisition, the company had paid about ₹0.455 cr to acquire 2,454,059 equity shares of ₹10 each (FY2014 annual report, page 72) i.e. Laurus Labs Ltd paid ₹0.455 cr for share capital of ₹2.45 cr.
This transaction on its face indicated that the value of the share capital of VBPL has eroded significantly by more than 80%.
Within one year of acquisition, in FY2015, Laurus Labs Ltd wrote off its entire investment done in VBPL indicating that the investment has gone wrong and would not produce any value for the shareholders of the company.
FY2015 annual report, page 78:
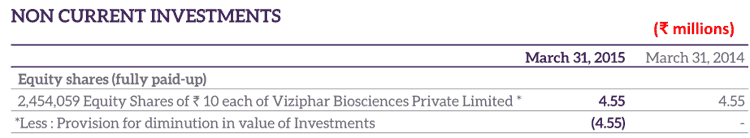
Therefore, in the very next year, in FY2016, the company sold its investment in VBPL to a third party and also wrote off advances of about ₹0.23 cr given to VBPL. (RHP, December 2016, page 335).
FY2016 annual report, page 43:
vide Agreement dated April 18, 2016, the Company had agreed to sell its entire shareholding in Viziphar Biosciences Private Limited to a third party
As per the RHP, December 2016, page 196, the company received about ₹0.3 cr for its sale of VBPL i.e. it lost more than half of its total investment in VBPL.
The company did not disclose the names of the third parties who bought VBPL. An investor may contact the company directly to understand more about this transaction and also the reasons for buying VBPL in the first place and writing off the entire investment within one year.
9) Management of foreign exchange fluctuation risk:
Over the years, Laurus Labs Ltd has witnessed a sharp fluctuation in the impact of movements in foreign exchange (forex).
At times, it has had large forex gains like ₹18 cr gain in FY2015, ₹24 cr gain in FY2017, ₹19 cr gain in FY2018, ₹17.7 cr gain in FY2021 and ₹10 cr gain in FY2022. On other occasions, it experienced significant losses due to foreign exchange fluctuations.
For example, in Q2-FY2019, the company reported a forex loss of ₹17 cr.
Conference call, November 2018, page 4:
V.V. Ravi Kumar:…forex losses – as you all aware that the rupee Depreciated close to ~6% in the quarter itself and the impact was close to INR 17 Crores
In Q4-FY2020, the company reported a forex loss of about ₹10 cr.
Conference call, April 2020, page 5:
V.V. Ravi Kumar: Last quarter it was about an around Rs. 10 Crores forex loss.
Laurus Labs Ltd has a forex risk hedging policy where it keeps its foreign exchange positions open up to exposure of $60 million. It does not prefer to hedge its forex exposure until it is below $60 million. As a result, it witnesses large forex gains and losses. As per the company, it is considering updating the hedging threshold of $60 million.
Conference call, November 2018, page 16:
V.V. Ravi Kumar: We have an forex policy to keep it open up to $60 million both trade and the debt so beyond $60 million we hedge…we are seriously looking at this current rupee depreciation whether do we need to reduce the limit
In addition, Laurus Labs Ltd gets a natural hedge in forex due to the import of raw materials where it makes payments in foreign currency. Moreover, the company has put certain clauses in its contracts with customers to protect itself from excessive movements of foreign exchange.
The credit rating agency, CARE, June 2022, page 3:
Foreign exchange fluctuation risk:…gets mitigated to certain extent as the contracts have clause embedded for the exchange rate fluctuation and there is natural hedging through netting off the imports and exports to a large extent.
To manage the forex risk further, Laurus Labs Ltd has taken loans in foreign currency so that its earnings in foreign currency can directly be used to make repayments of loans in foreign currency without converting the foreign currency into Indian Rupees.
In the past, the company started billing one of its Indian customers in USD so that it could protect itself against USD/INR fluctuation risk while making repayments for its USD borrowings, which come at a lower cost.
Conference call, January 2018, page 3:
V.V. Ravi Kumar: With one of our customers in India, we are billing in US dollar denomination instead of Indian rupees. So, our borrowings in the US dollar will go up and thereby our cost of funds will come down in the future quarters.
Nevertheless, Laurus Labs Ltd continues to witness large fluctuations in its results due to forex gains and losses. Going forward, an investor may monitor whether the company starts to improve its hedging activities.
10) Scope for improvement in internal processes and controls of Laurus Labs Ltd:
In the past, there have been certain instances, which indicate that the internal process and control have room for improvement.
In the case of administrative works, the company raised money from private equity investors in 2012, then it did not make proper filings with the Registrar of Companies (RoC).
RHP, December 2016, page 26:
including non-filing/ incorrect filing of the prescribed form with the RoC for allotment of Equity Shares on account of conversion of Series A Preference Shares of our Company in February 2012
In addition, it did not take the required shareholders’ approval before paying a salary to relatives of promoters.
RHP, December 2016, page 26:
failure to take necessary adequate shareholders approvals in relation to payment of salary to certain relatives of our executive and whole time Director and CEO, under applicable law
In the past, there have been two occasions of industrial accidents where there was a loss of life as well as loss of business due to the shutdown of operations.
In FY2017, one of its workers died while working and there was a blockage of the unit for 5 days.
RHP, December 2016, page 21:
On November 10, 2016, there was an incident at our Unit 1 facility in Vishakhapatnam, which resulted in a fatality and the temporary suspension of operations in the relevant manufacturing block for five days.
In FY2014, there was a major fire in one of the units of the company, which result in a significant loss of operations.
RHP, December 2016, page 21:
Further, in January 2014, there was a major fire accident at the manufacturing facility of Sriam Labs. This accident caused Sriam Labs to incur significant expenditure and led to the temporary shutdown of operations.
In the FY2014 annual report, the company presented different data about its future plans at different places. On page 9, it mentioned that by FY2016, it plans to have 3 sites whereas, on page 22, it mentioned that by FY2016, it would have 5 sites.
FY2014 annual report, page 9:
Going ahead, the Company expects to grow from two sites in 2013-14 to three sites in 2015-16
FY2014 annual report, page 22:
Company expects to increase the number of sites from two in 2012-13 to three in 2014-15 and five in 2015-16
At the time of IPO in December 2016, Laurus Lab Ltd intimated to the investors that it does not have a registered certain trademark including its logo. Such omission exposes the company to avoidable issues.
RHP, December 2016, page 22:
Also, we have applied for but not yet obtained certain trademark registrations, including for our Company’s logo.
An investor may contact the company directly to know if it has now received the registration for these trademarks including its logo.
The company did not provide details about the ageing of trade receivables in its annual reports for FY2018, FY2019, FY2020 and FY2021. The company provided a table containing the ageing of trade receivables in its FY2022 annual report.
Similarly, the company has not provided any explanation for its decline in stake in Laurus Bio Private Limited during FY2022.
FY2022 annual report, page 203:
As at March 31, 2022 the Company holds 76.60% (March 31, 2021: 79.21%) stake in Laurus Bio Private Limited.
The company acquired a 79.21% stake in Richcore Lifesciences Private Limited in FY2021 by buying out two private equity funds as well as buying a part of the stake from the promoters later on. Thereafter, it renamed the company Laurus Bio Private Limited.
At the same time, the promoters of Richcore Lifesciences Private Limited had stipulated a put option to sell their remaining stake of 20.79% in the company to Laurus Labs Ltd.
FY2021 annual report, page 173:
the selling shareholders (Promoters) have “put option” over 20.79 % shareholding at any time between January 20, 2024 and January 20, 2026 for a consideration equal to their proportion of the equity value of Laurus Bio.
Therefore, it seems that Laurus Labs Ltd had every intention of increasing its stake in Laurus Bio Private Limited by buying out the remaining stake of its promoters. However, in such a situation it comes as a surprise to the investor to see that in FY2022, the stake of Laurus Lab Ltd in Laurus Bio Private Limited has declined.
Moreover, the company has not provided any explanation in its annual report about the decline of its stake in Laurus Bio Private Limited. An investor may contact the company directly to know further details in this regard.
Due to a lack of oversight, the company made a mistake in the data presented in the investors’ presentation for Q1-FY2019. The same was circulated to investors and later on, the company had to mention the rectification in the conference call.
Conference call, August 2018, page 4:
V.V. Ravi Kumar:…small typo on the slide #12 where our EBITDA for Q1 FY2018 is incorrectly shown as 1,250 million, whereas it is about INR 1,045 million and the margin percentage is 21.6% instead of 26.1%
In FY2018, the company was required to form a dividend policy and disclose it in the annual report. The company formed a dividend policy but did not disclose it in the FY2018 annual report. As a result, the secretarial auditor highlighted this lapse in its report in the FY2019 annual report.
FY2019 annual report, page 91:
The Company has formulated the dividend policy and disclosed at the website of the Company. However, the same is not disclosed in the annual report for the year 2017-18.
In the announcement sent to stock exchanges for its AGM for FY2022, the company inadvertently made an error and mentioned the time as 3 PM instead of 4 PM. As a result, it had to submit a rectification letter to the stock exchanges.
Corporate announcement to BSE on April 28, 2022:
This is to inform all the Stakeholders of the Company that the time of I 71h Annual General Meeting of the Company which was erroneously shown as 03.00 PM (IST) on June 30, 2022 may be read as 04.00 PM (IST).
All these instances indicate a lack of oversight and room for strengthening internal processes and controls at Laurus Labs Ltd.
Moreover, on one occasion, the company created a step-down subsidiary in one year and the very next year, it applied to the Registrar of Companies for closing it down. In January 2021, Laurus Synthesis Private Limited formed a step-down subsidiary named Laurus Ingredients Private Limited.
FY2021 annual report, page 63:
The Company through its wholly owned subsidiary, M/s. Laurus Synthesis Private Limited incorporated a Step-Down Subsidiary named M/s. Laurus Ingredients Private Limited in January 2021, in India.
In the next year, FY2022, the company decided to close down Laurus Ingredients Private Limited.
FY2022 annual report, page 51:
decided to voluntarily strike off the name of the step down subsidiary of the Company, Laurus Ingredients Private Limited…since there was no business activity in this step down subsidiary for more than an year.
An investor would appreciate that such instances end up taking crucial time from management bandwidth.
The Margin of Safety in the market price of Laurus Labs Ltd:
Currently (July 6, 2022), Laurus Labs Ltd is available at a price-to-earnings (PE) ratio of about 33 based on consolidated earnings of FY2022.
However, we recommend that an investor may read the following articles to assess the PE ratio to be paid for any stock, which takes into account the strength of the business model of the company as well. The strength in the business model of any company is measured by way of its self-sustainable growth rate and the free cash flow generating the ability of the company.
In the absence of any strength in the business model of the company, even a low PE ratio of the company’s stock may be a sign of a value trap where instead of being a bargain; the low valuation of the stock price may represent the poor business dynamics of the company.
- 3 Principles to Decide the Ideal P/E Ratio of a Stock for Value Investors
- How to Earn High Returns at Low Risk – Invest in Low P/E Stocks
- Hidden Risk of Investing in High P/E Stocks
Analysis Summary
Overall, Laurus Labs Ltd seems a company, which has grown its sales at a rate of 24% year on year for the last 10 years. It increased its sales consistently every year; however, its profit margins have witnessed many fluctuations.
The profit margins declined in FY2015 due to work disruption resulting from the Hudhud cyclone in Andhra Pradesh. Profit margins declined again in FY2019 due to a sharp rise in raw material costs due to the Chinese crackdown on polluting industries, which disrupted the supply chain. However, an excellent performance of its formulation division increased profit margins to much higher levels in recent years.
Entry into the formulations segment has proved to be a very good decision for the company even though it had to bear a prolonged period of non-revenue generating assets when regulatory approvals and validation of the formulating units were going on. However, once these units started commercial production, then very quickly, Laurus Labs Ltd could use them fully and in turn, increased its business at a very fast pace during FY2020 and FY2021.
Apart from formulations, the entry of Laurus Labs Ltd in custom synthesis, Oncology APIs etc. has helped the company grow with improving profit margins. Encouraged by these developments, now the company has entered into recombinant technology, which is a very high margin segment.
Apart from diversification, other decisions of the company like creating capacities of new-age ARV drugs like Dolutegravir and Lamivudine have helped the company successfully deal with the transition in the HIV drug therapy from its previous product, Efavirenz.
When it faced a shortage of raw material (intermediates) from China, then it decided to do backward integration, which helped in strengthening its business model with vertical integration.
The company faced the impact of the lifecycle of drug therapies when its Hepatitis-C drugs lost their initial good performance and when the HIV treatment guidelines moved away from its key products. However, the company has handled such transitions well by focusing its attention on other drug segments.
The company has always focused on research & development and has been spending about 4%-7% of its sales on R&D. A large spending on R&D has helped it achieve a global leadership position in its products and a long-term relationship with its customers. Laurus Labs Ltd prefers to strengthen the relationship with existing customers to chase new customers. As a result, it derives a large part of its business from customers who have been with it for more than a decade.
Nevertheless, it deals in generic drugs where companies have low pricing power over their customers. Whenever its raw material prices have increased, then it has faced challenges in passing it on to its customers. As a result, it had to take a hit on its margins in FY2019.
The business of Laurus Labs Ltd is capital intensive where it has to create expensive manufacturing plants and then run them at a low utilization level during regulatory and customer approval (validation) phases. In addition, its business is working capital intensive because; the customers ask for a long credit period and it also has to maintain a large inventory for ensuing smooth supply of products to its customers.
As a result, its funds’ requirements are more than the cash that it could generate from its operations. Over time, it has met its requirement of excess funds using debt as well as equity dilution. Since its inception, it has had multiple rounds of equity dilution from three private equity players and an IPO. It remains to be seen whether the company would be able to make free cash flow in the future.
Nevertheless, since FY2016, the company is paying a regular dividend to its shareholders, which, unfortunately, is funded by debt, as it does not have a surplus cash flow after meeting its capex requirements to declare a dividend.
The company has completed most of its projects within a reasonable time; however, at times, it faced delays in project completion, which affected its business.
At times, the company has taken sub-optimal business decisions like its investment in Viziphar Biosciences Private Limited, which was written off fully within one year of purchase and decisions like establishing a subsidiary in one year and then closing it in the next year without starting any business. Such decisions put undue pressure on the management’s bandwidth.
Currently, the founder promoters are active in the day-to-day management of the company and at the same time, the son of the promoter has joined the company in an active role. It looks like the company has a succession plan in place. The promoters of the company have done a few related party transactions with the company like giving a guesthouse on lease to the company, which they had themselves taken on lease at a cheaper price.
At times, the promoters have taken a very high salary and increment even when the performance of the company had declined. On one occasion, the salary proposed to be given to the promoters exceeded the approved limit as well. In the past, promoters have purchased the information technology division from Laurus Labs Ltd and have invested in ImmunoACT along with the company in their personal capacity. All these transactions require deeper due diligence by the investors.
There have been a few instances where it looks like the internal processes and controls at Laurus Labs Ltd leave a room for improvement.
Going ahead, an investor should keep a close watch on the profit margins of the company to understand whether it is able to pass on the increase in its raw material costs to its customers. She should track the performance of its various diversification initiatives like selling formulations in the developed markets like the USA, entry in recombinant space etc. The investor should also monitor its capital deployment efficiency like capital consumption in inventory, and receivables as well as timely completion and commercialization of capital expenditure.
The investor should monitor whether the company is able to generate free cash flow or it continues to declare dividends, which are effectively funded by debt. She should track its forex gains and losses to assess whether it has improved its hedging policy. She should ask the company about its reduced stake in Laurus Bio Pvt Ltd as well as monitor future investments to see if it does more co-investments with promoters in their personal capacity.
Further advised reading: How to Monitor Stocks in your Portfolio
These are our views on Laurus Labs Ltd. However, investors should do their own analysis before making any investment-related decisions about the company.
You may use the following steps to analyse the company: “Selecting Top Stocks to Buy – A Step by Step Process of Finding Multibagger Stocks”
I hope it helps!
Regards,
Dr Vijay Malik
P.S.
- Subscribe to Dr Vijay Malik’s Recommended Stocks: Click here
- Chennai “Peaceful Investing” Workshop | 26 July 2026: Register Here
- To learn stock investing through videos, you may subscribe to the Peaceful Investing – Workshop Videos
- 25% savings on buying our Stock Analysis Excel Template and all ebooks together: Analysis Package: Excel Template + All eBooks (25% savings)
- To download our customized Stock Analysis Excel Template for analysing companies: Stock Analysis Excel
- Learn about our stock analysis approach in the e-book: “Peaceful Investing – A Simple Guide to Hassle-free Stock Investing”
- To learn how to do business analysis of companies: e-book: Business Analysis Guide
- To pre-register/express interest in a “Peaceful Investing” workshop in your city: Click here
Disclaimer
I, Vijay Malik, am a SEBI-registered Research Analyst (Regn. No. INH100008364). This article is for educational purposes only and does not constitute investment advice or a recommendation to buy or sell any securities. Investors should do their own research before making any investment decisions.
I, or my immediate relatives, do not have any financial interest in the companies discussed as on the date of publication of this article, nor do we hold one per cent or more of the securities of such companies at the end of the month immediately preceding it. I do not have any material conflict of interest and have not received any compensation or other benefits from the companies or any third party in relation to this article during the 12 months preceding its publication. I have not served as an officer, director, or employee of the subject companies, nor have I been engaged in market making activity for them.


12 thoughts on “Analysis: Laurus Labs Ltd”
Sir, I have read your in-depth analysis of Laurus Labs Ltd. It is very exhaustive, informative and instructive. Thank you, Dr Malik. I look forward eagerly to such deep research reports from you.
Thanks for your feedback, Mr T Sri Krishna. We appreciate it.
Nicely scripted.
Thanks for your feedback, Santosh!
Dear Sir,
How much time does it take for you to complete the analysis? Also, does the flow of the content and flow of the thought process remain the same?
Dear Rohan,
It took us about 2 weeks to do the analysis of Laurus Labs Ltd. We first read all the documents chronologically i.e. starting with the oldest reports and then reading each of them in a sequence. During this exercise, we keep noting down all the important developments about the company and the decisions of the management in a separate word document i.e. we collect all the “dots”.
Thereafter, once we revise our notes i.e. the “dots” a few times, then we are able to “connect the dots” and understand the underlying strategy of the company and the philosophy of the management.
Once we are able to “connect the dots”, then writing the article is just a flow of our thoughts about the company while maintaining the structure of the article i.e. first financial and business analysis, then operating efficiency analysis, then the margin of safety analysis (SSGR and FCF) followed by additional aspects.
Regards,
Dr Vijay Malik
Dear Sir,
How much time does it take for you to complete the analysis? Also, does the flow of the content and flow of the thought process remain the same?
We request you to identify yourself using your name.
Nice information.
Thanks.
This single article would benefit investors much more than the useless hyped write-ups and videos I saw for this stock on Twitter and YouTube. Truly an unbiased analysis of the business. Thanks, Doc.
Thanks for sharing your feedback, Stalin.