The current section of the “Analysis” series covers Maan Aluminium Ltd, an Indian company engaged in the manufacturing of extruded aluminium products and trading activities.
Please note that to get maximum benefit from this article, an investor should focus on the process of analysis instead of looking for good or bad aspects of the company. She should learn the interpretation of diverse types of data and transactions, and pay attention to the parts of annual reports etc., used to get the information. This will help her improve her stock analysis skills.
Maan Aluminium Ltd: Detailed Fundamental Analysis
Maan Aluminium Ltd does not have any subsidiaries or child entities. As a result, it reports only standalone financials.
We believe that while analysing any company, an investor should always look at the company as a whole and focus on financials, which represent the business picture of the entire company, including its subsidiaries, joint ventures etc. Consolidated financials of a company present such a picture. Therefore, if a company reports both standalone as well as consolidated financials, then the investor should prefer the analysis of the consolidated financials of the company.
While analysing the past financial performance of Maan Aluminium Ltd, we have analysed its standalone financials.
Further recommended reading: Standalone vs Consolidated Financials: A Complete Guide
With this background, let us analyse the financial performance of Maan Aluminium Ltd.
Financial and Business Analysis of Maan Aluminium Ltd:
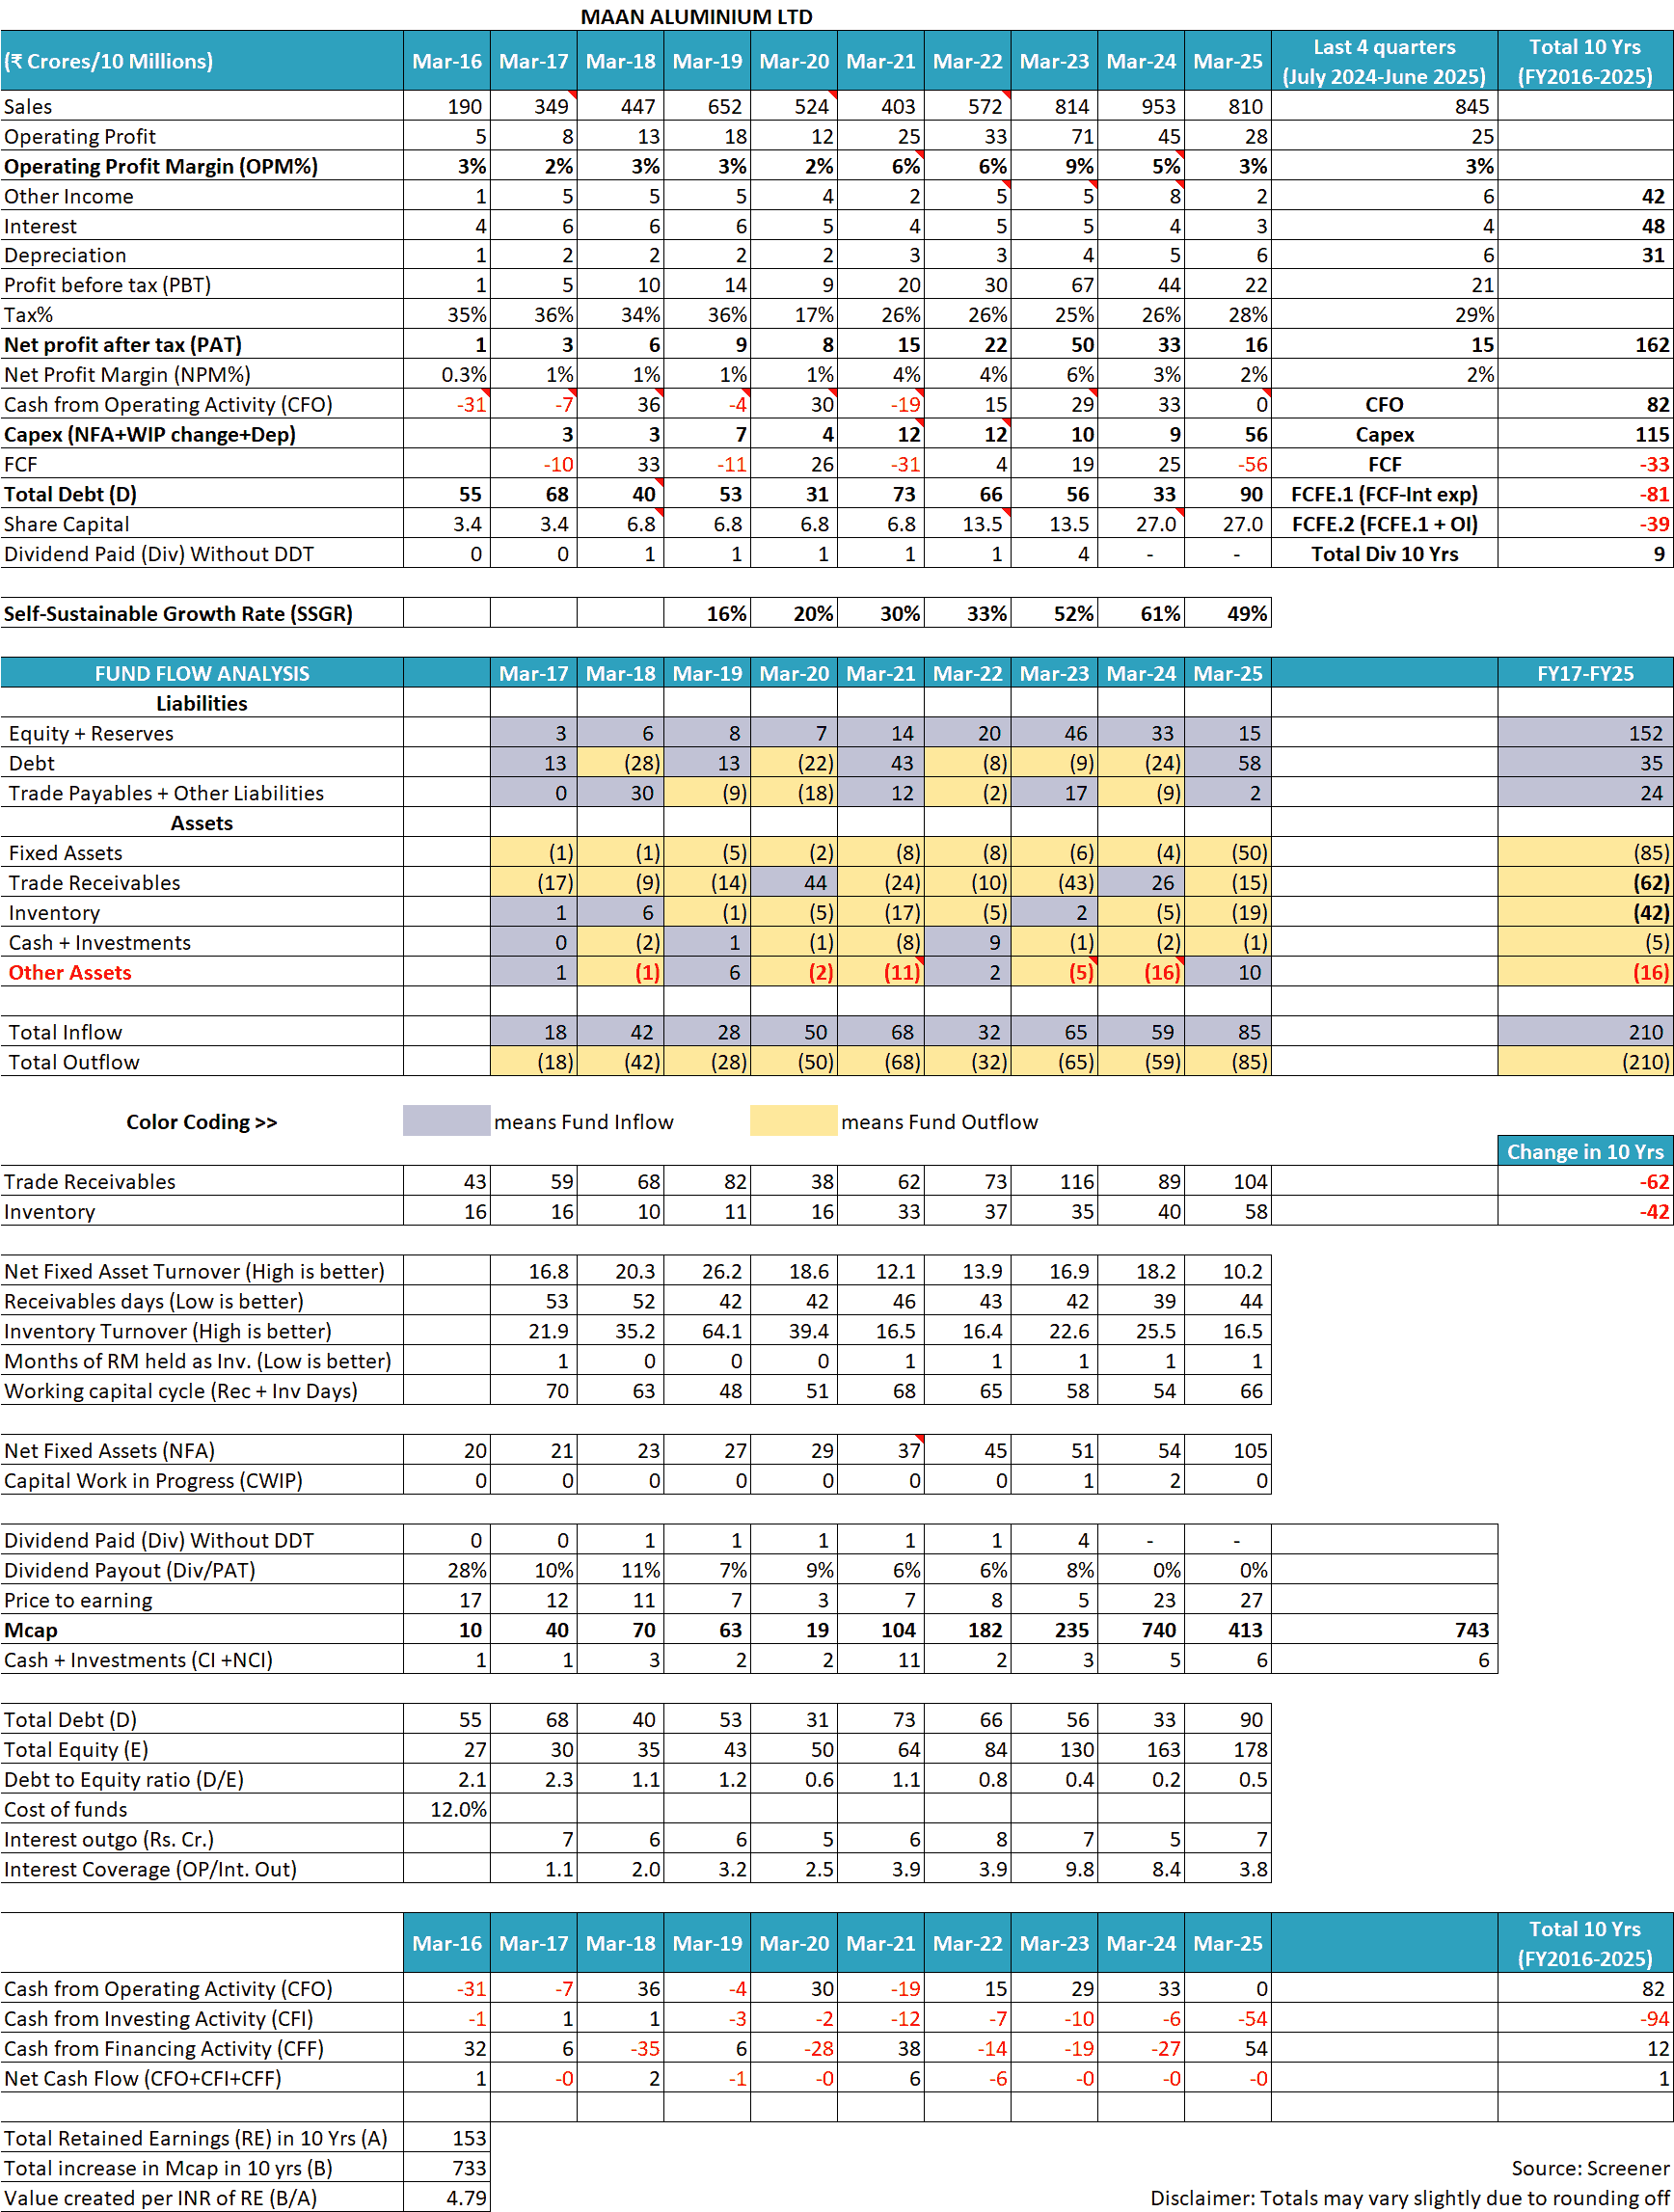
In the last 10 years (FY2016-FY2025), the sales of Maan Aluminium Ltd have increased at 17% year on year, from ₹190 cr in FY2015 to ₹810 cr in FY2025. In the last 12 months (July 2024-June 2025), sales of the company have increased to ₹845 cr.
However, growth of sales has not been consistent, and it has seen periods of declining sales. For example, over FY2020-FY2022, sales of Maan Aluminium Ltd decreased almost 40% from ₹652 cr in FY2020 to ₹403 cr in FY2022. Subsequently, sales declined by 15% from ₹953 cr in FY2024 to ₹810 cr in FY2025.
Over the last 10 years (FY2016-2025), the operating profit margin (OPM) of Maan Aluminium Ltd has fluctuated significantly in the range of 2% to 9%. The OPM increased from 2% in FY2017 to about 9% in FY2023, only to decline sharply to 3% in FY2025.
The net profit margin (NPM) of the company has also shown similar sharp fluctuations and has fluctuated between 0.3% to 6%. The NPM increased from 0.3% in FY2016 to 6% in FY2023, and thereafter, it declined sharply to 2% in FY2025.
Such sharp cyclical fluctuations in the financial performance of Maan Aluminium Ltd become further clear when an investor extends the scope of her analysis to the complete history of independent operations of the company from FY2007 onwards.
The table below consists of sales and net profit after tax data of Maan Aluminium Ltd from FY2007 to FY2025.
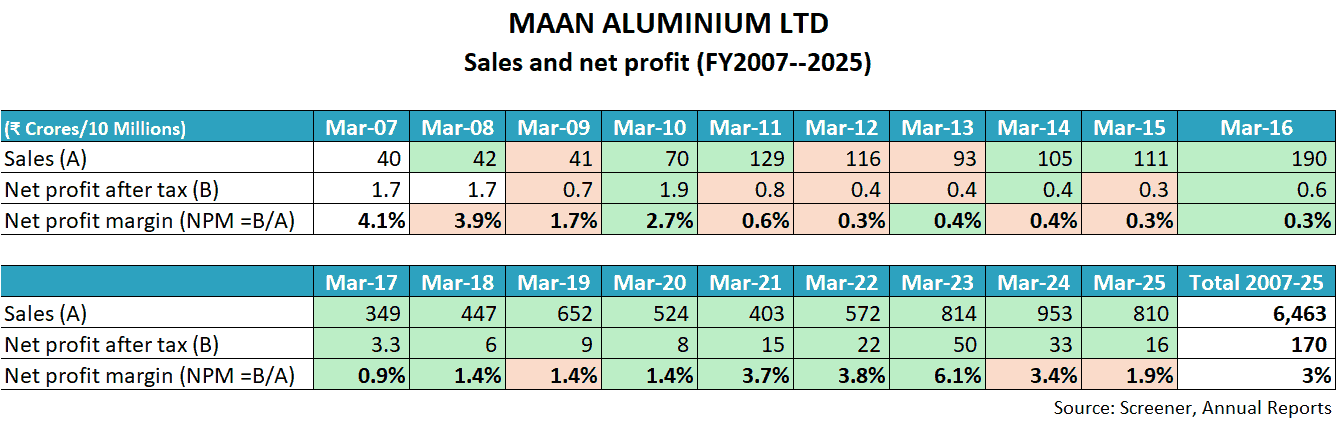
In the above data, an investor may notice cyclically sharp declines in the sales and profitability of Maan Aluminium Ltd over the years.
The company witnessed a sharp decline in sales by about 30% from ₹129 cr in FY2011 to ₹93 cr in FY2013. Similarly, its NPM has seen significant cyclical fluctuations from 4% in FY2007 to 0.3% in FY2012 to 6.1% in FY2023 to 1.9% in FY2025.
To understand more about Maan Aluminium Ltd, along with fluctuations in its sales and profit margins, an investor needs to read the publicly available documents of the company, like its annual reports from FY2007 available on the Bombay Stock Exchange (BSE) website, credit rating reports from CRISIL, Brickwork Ratings and ICRA, as well as its corporate announcements submitted to stock exchanges etc.
In addition, an investor should also read the following article explaining the key factors affecting the business of companies dealing in nonferrous metals like aluminium: How to do Business Analysis of Nonferrous Metal Companies
The above-mentioned documents show that the following key factors have influenced the business of Maan Aluminium Ltd, which are critical to understand for any investor.
1) Intense competition faced by Maan Aluminium Ltd from domestic as well as dumping by foreign players:
Aluminium players like Maan Aluminium Ltd face strong competition from both organised as well as unorganised players. The business of aluminium extrusion is not very capital-intensive or technologically intensive. As a result, numerous small players are able to set up plants and make the industry highly fragmented. These players provide intense competition to Maan Aluminium Ltd.
Credit rating report by ICRA, April 2025, page 2:
Intense competition in the industry – The company faces competition from organised and unorganised players in the fragmented aluminium extrusion industry, given the low capital investment and technical expertise required to produce extrusions with simple designs.
Apart from domestic manufacturers, Maan Aluminium Ltd also faces competition from cheaper imports/dumping by foreign players.
FY2025 annual report, page 18:
The aluminium business continues to be affected to a large extent by…low quality aluminium products being dumped by neighbouring countries.
A large number of domestic as well as dumping by foreign players lead to an oversupply of aluminium products in the Indian market, which provides strong obstacles to Maan Aluminium Ltd in growing its core manufacturing/extrusion business.
FY2024 annual report, page 20:
Supply of primary aluminum is in excess as India is one of the largest producers of primary aluminium.
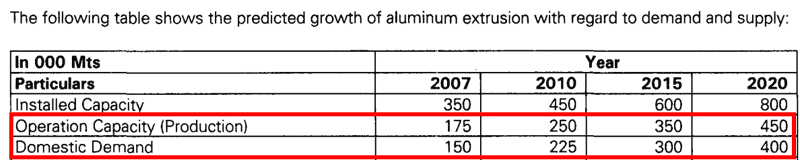
Oversupply of aluminium has been a consistent problem for Maan Aluminium Ltd, even in the past. For example, in FY2009 as well, the company highlighted that it is facing challenges due to oversupply of aluminium in the market. Moreover, the company projected that the supply will be in excess of demand even in the future.
FY2009 annual report, page 9:
In FY2015 as well, Maan Aluminium Ltd highlighted that the sector is facing oversupply, which is posing a challenge for the company.
FY2015 annual report, page 1:
Worldwide aluminium supply is outpacing demand, with subsequent pressure on pricing and premiums.
An investor would appreciate that in an industry where the supply of products is higher than demand, its manufacturers lose their bargaining/negotiating/pricing power over customers.
Also read: How to do Business Analysis of a Company
2) Low bargaining/negotiating/pricing power of Maan Aluminium Ltd over its customers:
On multiple occasions, the company highlighted to its investors that it has low pricing power over its customers. As a result, it faces continuous pressure on its profit margins.
Credit rating report by Brickwork Ratings, June 2019, page 2:
large number of small and unorganised players which also exerts pressure on the profit margins of MAL.
Whenever there is an increase in its input costs, it faces strong challenges in passing on the increase in costs to its customers. Therefore, whenever its input costs, i.e. aluminium prices increase, then it has to take a hit on its profit margins.
All the credit rating agencies, CRISIL, ICRA and Brickwork Ratings highlighted it in their reports for Maan Aluminium Ltd.
Credit rating report by CRISIL, March 2017, page 2:
The aluminium extrusion industry is fragmented and competitive. Hence, the company has limited pricing flexibility, and it cannot pass on the changes in raw material prices to customers.
Credit rating report by ICRA, April 2025, page 1:
ratings are, however, constrained by the susceptibility of the margins to fluctuations in raw material prices…intense competition, given the highly fragmented nature of the industry.
Credit rating report by Brickwork Ratings, April 2021, page 1:
strengths are offset by…exposure to volatility in raw material prices and intense competition in the industry.
The low pricing power of Maan Aluminium Ltd has impacted its financial performance whenever aluminium prices saw large fluctuations in the past.
For example, in FY2020, its operating profit margin declined to a low of 2%.
FY2020 annual report, page 4:
Current year noticed tremendous volatility in commodity prices and aluminium also record low prices which impacted our total revenue from operation.
During its historical analysis, when in FY2009, its net profit margin declined to a low of 1.7%, it was due to higher input costs, which the company could not pass on to its customers.
FY2009 annual report, page 10:
The realisation was lower due to high input cost compiled with rupee depreciation.
In FY2013, when Maan Aluminium Ltd suffered a decline in both its sales as well as its revenue, it was due to extreme competitive pressures.
FY2013 annual report, page 1:
net margins in the main line products of your Company have been under pressure inspite of increased production, resulting in the net profit for the year under review reducing
The company faced similar challenges in FY2015 when it saw its net profit as well as profit margin decline. The company reported an NPM of 0.3% in FY2015.
FY2015 annual report, page 1:
there has been a global meltdown in commodity prices…This has led to a sharp fall in the realizations of companies involved in manufacturing and selling aluminium in the market.
The impact of fluctuations in the global aluminium prices was so strong that Maan Aluminium Ltd had to postpone its expansion plans.
FY2016 annual report, page 1:
With the global fluctuation in commodity markets, our financials have been impacted, which has also affected our expansion and future development plans
Also read: How to analyse New Companies in Unknown Industries?
3) Strategies adopted by Maan Aluminium Ltd to improve its financial performance:
Maan Aluminium Ltd, along with most other Indian aluminium manufacturers, faces the issue of very low value addition in its products. As a result, they have low pricing power in their product segments. Whereas the demand for high-value-added aluminium products in India is met by imports.
FY2024 annual report, page 20:
Supply of primary aluminum is in excess as India is one of the largest producers of primary aluminium. However, due to limited scope of value addition within the country…companies import a size- able quantity of downstream products.
3.1) Pairing aluminium purchases with receipts of customer orders:
To mitigate the impact of lower pricing power and to somewhat protect its profit margins, Maan Aluminium Ltd tries to time its purchase of aluminium with the receipt of customers’ orders so that it can minimise the impact of volatility of aluminium prices on its stock.
Credit rating report by ICRA, April 2025, page 2:
the company matches sales with purchases, mitigating the raw material price risk to an extent.
Also read: How to study Annual Report of a Company
3.2) Entering the aluminium trading business:
When Maan Aluminium Ltd started facing strong competition and pricing pressures in its manufacturing/aluminium extrusion business, it started focusing on the trading business to improve its financial performance.
Currently, Maan Aluminium Ltd is an exclusive distributor for aluminium billets etc. of Hindalco in large Indian territories.
Credit rating report by ICRA, April 2025, page 2:
company is an exclusive distributor of Hindalco for the trading of aluminium billet/ingot and wire rods in north and south India (ex-Hyderabad).
A sharp jump in the company’s revenue in the last decade is primarily due to trading operations. For example, in FY2016, sales of Maan Aluminium Ltd increased by more than 70% from ₹111 cr in FY2015 to ₹190 cr in FY2016, mainly due to an increase in trading operations.
FY2016 annual report, page 1:
substantial increase in our revenue from operations…is primarily due to an increase in the volume and performance from our trading operations.
Increase in trading operations increased the company’s revenues by more than 80% next year in FY2017, when Maan Aluminium Ltd’s sales increased from ₹190 cr in FY2016 to ₹349 cr in FY2017.
Credit rating report by Brickwork Ratings, May 2018, page 2:
revenues increased from Rs. 190.33 Crs in FY 16 to Rs. 349.56 Crs in FY 17 mainly supported by trade revenues
3.3) Attempts to increase value addition in its products:
Maan Aluminium Ltd tried to increase value-addition in its manufactured/extruded products by activities like anodising and powder-coating so that it can earn a better margin in its business.
Credit rating report by ICRA, April 2025, page 3:
company has in-house anodising and powder coating facilities to manufacture value-added products.
Also read: Credit Rating Reports: A Complete Guide for Stock Investors
3.4) Entry into the high-margin exports business by Maan Aluminium Ltd:
The company also started focusing on exports in order to have a better margin profile in its business.
In FY2022, the company reported a significant growth of more than 40% in its sales from ₹403 cr in FY2021 to ₹572 cr in FY2022, which was primarily due to an increase in its export business.
Credit rating report by ICRA, March 2023, page 3:
company’s operating income surged 42% to Rs. 581.2 crore in FY2022…owing to a healthy increase in sales realisation along with an increase in export sales volume, which are high margin accretive
4) Low fluctuating profit margins in the trading business of Maan Aluminium Ltd:
Over time, the company realised that even though the trading business increased its revenues significantly, it barely had any profits. Maan Aluminium Ltd faced low and highly fluctuating profit margins in its trading operations.
Credit rating report by ICRA, June 2019, page 2:
operating profit margin decreased…as the revenue contribution from trading activities increased from 76% in FY18 to 80% in FY19.
In FY2024, operating profit margins of Maan Aluminium Ltd declined sharply to 5% from 9% in FY2023, primarily due to a higher share of trading activities and a lower share of export business.
Credit rating report by ICRA, April 2024, page 1:
company’s operating margin declined to 4.8% in 9M FY2024 compared to 9.2% in the previous year owing to a lower proportion of export sales, which garner high margin and high proportion of trading sales.
As a result, Maan Aluminium Ltd decided to shift its focus from the trading business back to its manufacturing business.
Credit rating report by ICRA, April 2025, page 2:
the margin in the trading business remains volatile, given the fluctuations in aluminium prices. The company’s trading business has reduced over the years, mitigating the volatility to an extent.
For example, in FY2023, Maan Aluminium Ltd had a sharp increase in its operating profit margin to 9% from 6% in FY2022 as the company focused more on its manufacturing/extrusion business instead of its trading business.
Credit rating report by ICRA, March 2023, page 1:
proportion of trading sales in revenues has reduced to 43% in 9M FY2023 from ~75% in FY2018 owing to higher volatility and low profit margin in the trading business and more focus towards manufacturing business
Nevertheless, the core business of Maan Aluminium Ltd remains highly cyclical and undergoes alternate periods of high and low demand.
In FY2025, it reported a sharp decline in its sales of about 15% to ₹810 cr from ₹953 cr in FY2024 and a similar drop in operating profit margins to 3% from 5% in FY2024 due to a decline in demand in both its manufacturing and trading businesses.
Credit rating report by ICRA, April 2025, page 1:
performance in FY2025 was impacted by lower volumes in both the trading and manufacturing businesses due to a weak demand environment.
Also read: Why We cannot always Trust What Management Claims
5) Regulatory/policy risk faced by Maan Aluminium Ltd:
As aluminium is an internationally traded commodity; therefore, the policies of different countries impact demand, supply and price of aluminium products. These policies have a strong impact on the business of aluminium manufacturers, including Maan Aluminium Ltd.
Most of the time, regulatory measures by different countries, like tariffs, anti-dumping duties etc. present a significant risk to the business of Maan Aluminium Ltd.
For example, in FY2025, the USA started an anti-dumping investigation on the supply of aluminium products from multiple countries, including India.
FY2025 annual report, page 35:
Aluminium Sector also went through extreme volatility owing to the fluctuations is the Price of Primary Products along with Anti-Dumping investigations initiated by US Department of commerce in India along with 12 more countries.
Subsequently, in June 2025, the USA increased import duty on aluminium products from 25% to 50%. It is a significant event for Maan Aluminium Ltd because in FY2025, the company earned about 40% of its revenue from exports, out of which about 85-90% of exports are to the USA.
Credit rating report by ICRA, June 2025, page 1:
June 03, 2025, the United States of America (US) has increased the tariff on the import of steel and aluminium products to 50% from 25%…In FY2025, exports accounted for ~40% of Maan Aluminium Limited’s (MAL) manufacturing revenues, with the US contributing 85-90% to the total exports.
As a result, the business of Maan Aluminium Ltd faces strong regulatory risk where any change in the government policies in India or overseas can impact its business significantly.
Going ahead, an investor should keep a close watch on the fluctuations in the sales and profit margins of Maan Aluminium Ltd to understand whether it is able to bring any competitive strength in its business model and earn any pricing power over its customers or not.
Over the last 10 years (FY2016-FY2025), the tax payout ratio of Maan Aluminium Ltd has been in line with the standard corporate tax rate in India, except in FY2020, where many companies that opted for the new corporate tax regime reported lower taxes as they reassessed their deferred taxes.
Also read: How to do Financial Analysis of a Company
Operating Efficiency Analysis of Maan Aluminium Ltd:
a) Net fixed asset turnover (NFAT) of Maan Aluminium Ltd:
Over the years, NFAT of the company has decreased from 16.8 in FY2017 to 10.2 in FY2025. A declining NFAT indicates sub-optimal utilisation of assets by the company.
However, an investor needs to keep in mind that manufacturing operations of any company usually have an NFAT of 4-5 or less. Companies that have an NFAT of 5 or more, say exceeding 10, are primarily service or trading businesses that require very low investment in fixed assets to generate their sales.
As the share of trading business increased in the sales of Maan Aluminium Ltd, its NFAT increased from 16.8 in FY2017 to 26.2 in FY2019. However, subsequently, the company increased its focus back on its manufacturing/extrusion business, and its NFAT declined to 10.2 by FY2025.
Going ahead, an investor should keep a close watch on the fixed asset turnover levels of the company to assess whether it is able to optimally utilise its manufacturing assets.
Further advised reading: Asset Turnover Ratio: A Complete Guide for Investors
b) Inventory turnover ratio (ITR) of Maan Aluminium Ltd:
Over the years, the inventory turnover ratio (ITR) of the company has declined from 21.9 in FY2017 to 16.5 in FY2025. A decline in ITR indicates declining efficiency of inventory management by the company.
Inventory turnover of the company has also fluctuated in line with its focus on trading operations. Initially, the ITR of Maan Aluminium Ltd increased sharply to 64.1 in FY2019 as trading operations constituted a major portion of its revenue.
However, later on, the ITR declined to 16.5 as the company shifted its focus back to the manufacturing/extrusion business.
For companies dealing in commodities with volatile prices, it is essential that they keep a high level of efficiency in inventory management because any decline in the market price of commodities impacts the valuation of their existing inventory stock.
At times, the loss of value of existing inventory can be significant if it is purchased at a high price in the past, whereas later on, the commodity prices decline, indicating that now, the customers will pay a lower price for their products in line with current low prices. Such a situation can lead to significant impairment losses like Maan Aluminium Ltd faced in FY2016.
FY2017 annual report, page 2:
commodities sector came under considerable pressure in FY 2016, impacting our financial performance and resulting in impairment charges.
Therefore, going ahead, an investor should keep a close watch on the inventory position of the company to understand whether it is able to utilise its inventory efficiently or not.
Further advised reading: Inventory Turnover Ratio: A Complete Guide
c) Analysis of receivables days of Maan Aluminium Ltd:
Over the years, receivables days for the company have improved from 53 days in FY2017 to 44 days in FY2025. However, the company has faced challenges in collecting its receivables on time from its customers.
The company started facing a large amount of receivables when it shifted its focus to the trading business. As a result, its reliance on working-capital debt to finance its trade receivables increased significantly.
Credit rating report by CRISIL, March 2017, page 1:
working capital requirement (emanating primarily from trading receivables) has significantly increased, leading to a higher dependence on fund-based working capital limit.
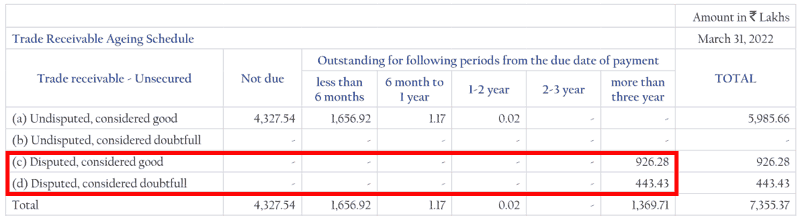
Maan Aluminium Ltd faced disputes in collecting its money from its customers, and there were instances where customers did not pay it the money even after more than 3 years when it was due for payment.
Credit rating report by CRISIL, March 2023, page 1:
some of the debtors from the trading business remain stuck for more than three years
For example, in FY2022, the company had more than ₹13 cr stuck with customers for more than 3 years.
FY2022 Annual report, page 73:
Overdue receivables led to large write-offs, where Maan Aluminium Ltd recognised these losses under bad debts. For example, in FY2023, the company reported bad debts of about ₹3.6 cr., which is hard-earned money gone down the drain.
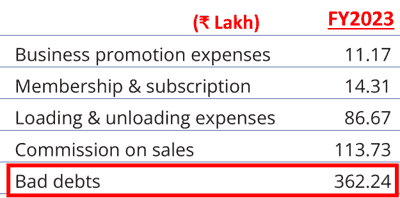
Similarly, in FY2020, Maan Aluminium Ltd wrote off ₹2.9 cr as bad debt (FY2020 annual report, page 58) and in FY2018. Maan Aluminium Ltd had written off ₹2.2 cr. (Source: FY2018 annual report, page 46).
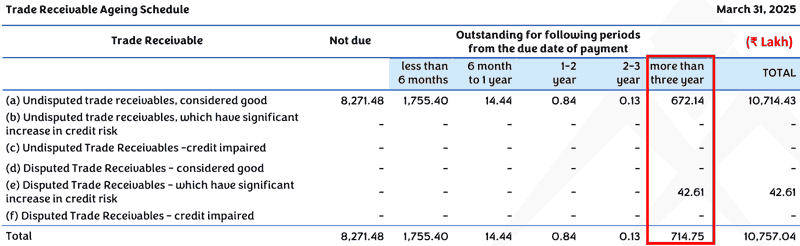
In FY2025, Maan Aluminium Ltd has trade receivables of more than ₹7 cr outstanding for more than 3 years from their due date for collection.
FY2025 annual report, page 95:
Going ahead, an investor should watch the trend of receivables days of Maan Aluminium Ltd to assess whether it is able to collect its receivables on time to run its business from its business/operating cash flows.
Further recommended reading: Receivable Days: A Complete Guide
When an investor compares the cumulative net profit after tax (cPAT) and cumulative cash flow from operations (cCFO) of Maan Aluminium Ltd for FY2016-FY2025, then she notices that over the years (FY2016-FY2025), the company is not able to convert its profit into cash flow from operations.
Over FY2016-25, Maan Aluminium Ltd reported a total cumulative profit after tax (cPAT) of ₹162 cr. During the same period, it reported a cumulative cash flow from operations (cCFO) of ₹82 cr.
It is advised that investors should read the article on CFO calculation, which would help them understand the situations in which companies tend to have the CFO lower than their PAT. In addition, the investors would also understand the situations when the companies would have their CFO higher than PAT.
Further recommended reading: Understanding Cash Flow from Operations (CFO)
The Margin of Safety in the Business of Maan Aluminium Ltd:
a) Self-Sustainable Growth Rate (SSGR):
Read: Self Sustainable Growth Rate: a measure of Inherent Growth Potential of a Company
Upon reading the SSGR article, an investor would appreciate that if a company is growing at a rate equal to or less than the SSGR and it can convert its profits into cash flow from operations, then it would be able to fund its growth from its internal resources without the need for external sources of funds.
Conversely, if any company attempts to grow its sales at a rate higher than its SSGR, then its internal resources would not be sufficient to fund its growth aspirations. As a result, the company would have to rely on additional sources of funds, like debt or equity dilution, to meet the cash requirements to generate its target growth.
An investor may calculate the SSGR using the following formula:
SSGR = NFAT * NPM * (1-DPR) – Dep
Where,
- SSGR = Self Sustainable Growth Rate in %
- Dep = Depreciation rate as a % of net fixed assets
- NFAT = Net fixed asset turnover (Sales/average net fixed assets over the year)
- NPM = Net profit margin as % of sales
- DPR = Dividend paid as % of net profit after tax
(For systematic algebraic calculation of SSGR formula: Click Here)
Over the years, SSGR of Maan Aluminium Ltd has seen high levels of SSGR, like 30%-50% and even more. An investor would notice that SSGR is directly dependent on NFAT, and Maan Aluminium Ltd has had very high NFAT due to its significant share of trading operations.
As a result, it has reported high SSGR in comparison to its annualised sales growth of 17% over the last 10 years (FY2016-FY2025).
However, from the SSGR article, an investor would notice that SSGR assumes that the company has converted its net profits into cash, which it uses to reinvest in its business for growth.
As discussed earlier, Maan Aluminium Ltd has not converted its profits into cash flow from operations. As a result, despite reporting a high SSGR, the company has had to rely on debt to fund its business growth.
The situation becomes further clear when an investor does a free cash flow analysis of Maan Aluminium Ltd.
b) Free Cash Flow (FCF) Analysis of Maan Aluminium Ltd:
While looking at the cash flow performance of Maan Aluminium Ltd, an investor notices that during FY2016-FY2025, it generated a cash flow from operations of ₹82 cr. During the same period, it made a capital expenditure of about ₹115 cr.
Therefore, during this period (FY2016-FY2025), Maan Aluminium Ltd had a negative free cash flow (FCF) of (₹33) cr (= 82 – 115).
In addition, during this period, the company had a non-operating income of ₹42 cr and an interest expense of ₹48 cr. As a result, the company had a total negative free cash flow of ₹39 cr (= -33 + 42 – 48). Please note that the capitalised interest is already factored in as part of the capex deducted earlier.
Over the years, Maan Aluminium Ltd has relied on additional debt to fund this cash shortfall. In the last 10 years, the total debt of the company has increased by ₹35 cr from ₹55 cr in FY2016 to ₹90 cr in FY2025.
Going ahead, an investor should keep a close watch on the cash flow position of Maan Aluminium Ltd to understand whether the company is able to generate surplus cash from its business or it relies on outside funds for growth and running its day-to-day operations.
Further recommended reading: Free Cash Flow: A Complete Guide to Understanding FCF
Self-Sustainable Growth Rate (SSGR) and free cash flow (FCF) are the main pillars of assessing the margin of safety in the business model of any company.
Further advised reading: 3 Simple Ways to Assess “Margin of Safety”: The Cornerstone of Stock Investing
Additional aspects of Maan Aluminium Ltd:
On analysing Maan Aluminium Ltd and after reading annual reports, credit rating reports and other public documents, an investor comes across certain other aspects of the company, which are important for any investor to know while making an investment decision.
1) Management Succession of Maan Aluminium Ltd:
The company was originally a part of Man Industries (India) Ltd and was promoted by the Mansukhani family. In FY2007, the company was demerged as Man Aluminium Ltd.
In FY2010, brothers, Mr Ravinder Nath Jain and Mr Mohinder Jain, took control of the company when the Jain family acquired a 65% stake from the Mansukhani family and in FY2011, they renamed the company to Maan Aluminium Ltd.
In FY2015, Mr Mohinder Jain left the company, apparently due to a family settlement by transferring his stake to his brother’s family (Source).
Currently, Mr Ravinder Nath Jain (Chairman & Managing Director, aged 66 years), his son-in-law, Mr Ashish Jain (Executive Director, aged 44 years) and one of his daughters, Ms Priti Jain (aged 42 years) represent the promoters’ family on the board.
The presence of members of the next generation of family in the company when the elder promoter is still serving an active role seems to be a well-thought-out management succession plan.
It is especially essential in the case of promoter-run businesses, as it provides for a smooth transition of leadership over the generations and provides continuity in the business operations of any company. Moreover, as the next generation seems to have joined the business in active roles while the older generation is still active, therefore, this might allow them a good time to learn the business under able guidance.
Nevertheless, an investor should keep a close watch on the dynamics between the members of the promoter family. This is because any discord between the two daughters of Mr Ravinder Nath Jain: Ms Priti Jain and Ms Dipti Jain (wife of Mr Ashish Jain, Executive Director) might lead to infighting and, in turn, divert the focus of the leadership away from the best interests of public shareholders.
Also read: How to do Management Analysis of Companies?
2) Related party transaction of Maan Aluminium Ltd with promoters’ entities:
The company has been involved in multiple transactions with promoters and their group entities, like sales, purchases, rent, and taking loans etc.
For example, the company had taken loans from the promoter Mr Ravinder Nath Jain for about ₹13 cr in FY2024 and ₹6 cr in FY2025. (FY2025 annual report, page 112).
Maan Aluminium Ltd has been paying rent to promoters Mr Ravinder Nath Jain and his daughter Ms Priti Jain (FY2025 annual report, page 112).
In the past, the company purchased four-wheelers from the promoter Mr Ravinder Nath Jain and a promoter-group entity, Aditya Aluminium (FY2021 annual report, page 98).
The company has also made purchases of goods from promoter entities like J P Engineers, SMW Metal Pvt. Ltd (FY2014 annual report, page 21) and sold goods to Aditya Aluminium (FY2016 annual report, page 42).
Apart from remuneration to promoter-directors, Maan Aluminium Ltd has also been paying remuneration and professional fees to the wife of the promoter, Ms Alka Jain; daughter of the promoter and the wife of Executive Director, Ms Dipti Jain, as well as to the wife of the CEO, Ms Monika Chadha (FY2025 annual report, page 112). An investor may contact the company directly to seek any clarifications about the roles played/contributions made by these personnel to the company and the shareholders.
An investor may note that each of such sale/purchase/rent/loan/professional fees transactions provides an opportunity for shifting of economic benefit from public shareholders to promoters if the listed company buys goods/services from promoter entities at a price higher than their market price or sells goods/services to promoter entities at a price lower than their market price. Therefore, an investor should always do deeper due diligence of such sale/purchase transactions with related parties.
Also read: How Promoters benefit from Related Party Transactions
3) Capacity expansions by Maan Aluminium Ltd:
Historically, the company has increased its manufacturing capacity significantly. When Maan Aluminium Ltd was demerged from Man Industries (India) Ltd in FY2007, it had a manufacturing capacity of 7,000 MTPA.
- In FY2012, the company installed new machinery and increased the capacity to 9,000 MTPA.
- In FY2023, the company increased its manufacturing capacity further to 10,000 MTPA.
- In FY2025, Maan Aluminium Ltd increased its manufacturing capacity to 24,000 MTPA.
However, at times, it seems that the company invested money into creating additional capacity when it had low-capacity utilisation in its existing machinery and had spare capacity available.
For example, at the time of the significant expansion of capacity from 10,000 MTPA to 24,000 MTPA in FY2025, it had a production level of 7,653 MT during FY2025 (Source: FY2025 annual report, page 18). In addition, during FY2025, the company has also acquired two facilities/sick units in Dewas and Pithampur, where it would have to spend additional money to make them operational.
Similarly, in FY2012, when Maan Aluminium Ltd increased its production capacity from 6,000 MTPA to 9,000 MTPA, it achieved a production of 3,166 MT (Source: FY2013 annual report, page 1).
From earlier discussion, an investor would remember that the aluminium industry in India has continuously suffered from oversupply. In addition, due to the inability of Maan Aluminium Ltd to convert its profits into cash flow from operations, it has to rely on debt to fund its cash flow shortfalls.
In such a situation, an investor may make up her own views about whether these capacity expansion decisions by Maan Aluminium Ltd were appropriately timed.
Also read: How to Identify if Management is Misallocating Capital
4) Interest on overdue trade receivables by Maan Aluminium Ltd:
Over the years, the company has reported a significant amount of other income; a total of ₹42 cr over the last 10 years (FY2016-2025). At times, other income has been a very large proportion of and even exceeded its net profit after tax (FY2017).
Analysis of other income highlights that most of the other income comprises interest income, which is very high when compared to the level of cash & investments maintained by Maan Aluminium Ltd.
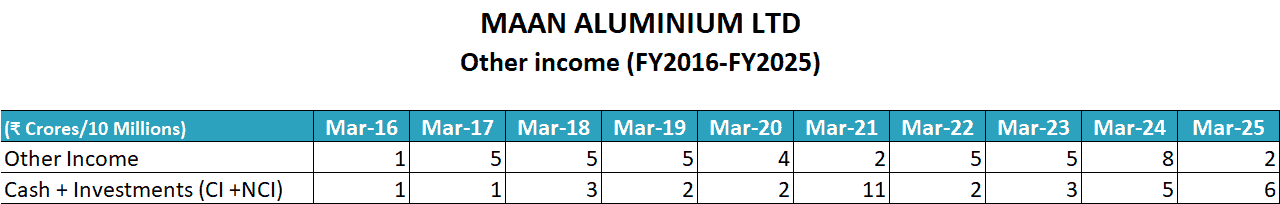
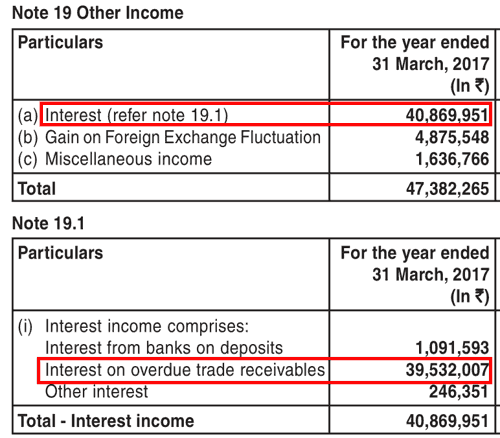
For example, in FY2017, when Maan Aluminium Ltd had a cash & investments balance of about ₹1 cr, it reported other income of about ₹4.7 cr., which included interest income of ₹4 cr.
As an interest income of ₹4 cr on cash & investments of ₹1 cr looks high, therefore, a deeper analysis indicates that Maan Aluminium Ltd has recognised an interest of ₹3.9 cr on delayed trade receivables.
FY2017 annual report, page 38:
An investor would note that Maan Aluminium Ltd had serious issues in recovering its money from its customers, as shown by a cumulative CFO of only ₹82 cr against a cumulative PAT of ₹162 cr in the last 10 years (FY2016-2025). Our earlier discussion highlighted that the company had significant receivables overdue for more than 3 years, which were under dispute. As a result, Maan Aluminium Ltd had to write off large trade receivables as unrecoverable.
Under such circumstances, an investor may make up her mind whether recognising interest income on overdue trade receivables is appropriate. This is because including such interest income in the profit & loss statement (P&L) increases the reported net profit; however, there is no certainty that the company would be able to collect this interest income when the recovery of underlying trade receivables itself is under question.
An investor may contact the company directly to understand how much of such interest income on overdue trade receivables was actually received by the company from its customers.
Also read: How Companies Inflate their Profits
5) Differences in the data submitted by Maan Aluminium Ltd to shareholders and to the banks:
There have been multiple instances where the data shared by the company for key items like trade receivables, inventory and trade payables to the shareholders in its quarterly financials was significantly different from the data shared by the company to banks for those same quarters.
For example, the table below shows the large differences in the receivables, payables and inventory data shared by Maan Aluminium Ltd to banks and to shareholders for March 31, 2025, as highlighted by the auditor of the company in its FY2025 annual report, at page 81:
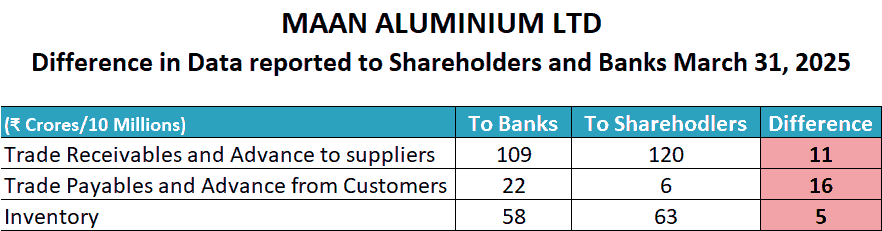
The auditor of the company has highlighted similar differences in the data reported by the company to its shareholders and banks for other quarters as well. For example, differences up to:
- ₹8 cr in Dec. 2024, ₹14 cr in Sept 2024, and ₹19 cr in June 2024 (Source: FY2025 annual report, page 81),
- ₹17 cr in March 2024, ₹22 cr in Dec. 2023, ₹12 cr in Sept 2023, and ₹15 cr in June 2023 (Source: FY2024 annual report, page 84),
- ₹25 cr in March 2023 and ₹16 cr in Sept 2022 (FY2023 annual report, page 70).
In light of such large differences in critical financial data reported to shareholders and the banks, an investor should be cautious while analysing the data reported by the company. She should increase her depth of due diligence and attempt to cross-verify any data from more than one source before making any investment decision based on such data.
Also read: 7 Signs to tell whether a Company is cooking its Books: “Financial Shenanigans”
6) Weakness in internal controls and processes at Maan Aluminium Ltd:
Apart from the above-highlighted weakness in reporting of financial data to shareholders and banks, Maan Aluminium Ltd shows other signs of weakness in internal controls and processes as well.
For example, at times, the company did not deposit its undisputed statutory dues to the government on time (Source: FY2011 annual report, page 25 and FY2012 annual report, page 22).
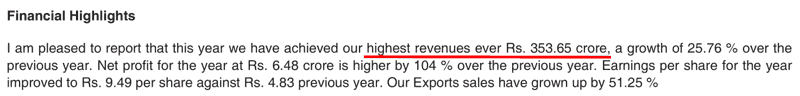
On other occasions, annual reports of Maan Aluminium Ltd contained errors. For example, in the FY2018 annual report, in the CEO Message, Mr Sandeep Verma stated that in the year, Maan Aluminium Ltd reported a revenue of ₹353.65 cr, whereas in reality, in FY2018, the company had a revenue of ₹449 cr (FY2018 annual report, page 35).
FY2018 annual report, page 3:
Similarly, in FY2021, the company, in its Board’s Report, stated that its total income increased from ₹528 cr in the last year to ₹405 cr, whereas if the investor notices closely, then in FY2021, the total income of the company had not increased but actually decreased from FY2020.
FY2021 annual report, pages 19-20:
During the year, the total income of your Company went up from Rs. 528.06 Crore to Rs. 405.32 Crore.
In the same way, in the FY2022 annual report, the company reported that during the year, it had a production of 6960.31 MT against 7569.20 MT in FY2021. However, this data was erroneous.
FY2022 annual report, page 32:
During FY 2021-2022, the Company has achieved production of 6960.31 MT as compared to 7569.20 MT during the previous year.
In reality, the company had copied and pasted the production data of FY2021 (6960.31 MT) as the data for FY2022 in the annual report. See below the section from the FY2021 annual report of the company, page 36:
During FY 2020-2021, the Company has achieved production of 6960.31 MT as compared to 6535.55 MT during the previous year.
While looking at the multiple instances of data discrepancy, delays in the timely deposit of undisputed dues, and errors in the public disclosures, an investor notices that there is a scope for improvement in the internal controls and processes at the company.
An investor may read the example of National Peroxide Ltd, a Wadia Group company, where there was a history of inadequate internal controls, and later, a fraud came out, indicating that the senior management was siphoning off the money for almost 10 years. Later on, the company fired the senior management, including the managing director of the company.
An investor may read our detailed analysis of National Peroxide Ltd and the fraud due to weak internal controls in the following article: Analysis: National Peroxide Ltd
7) Selling of stake by promoters of Maan Aluminium Ltd:
In the last couple of years, with the increasing share price of Maan Aluminium Ltd, its promoters have continuously sold shares in the market. As a result, their stake in the company has decreased from 66% earlier to about 59% now.
Since June 2023, promoters have sold shares worth about ₹43 cr. The screenshot below from the Screener website shows the details of insider trades of Maan Aluminium Ltd with names of promoters, shares sold, duration and the value of sale.
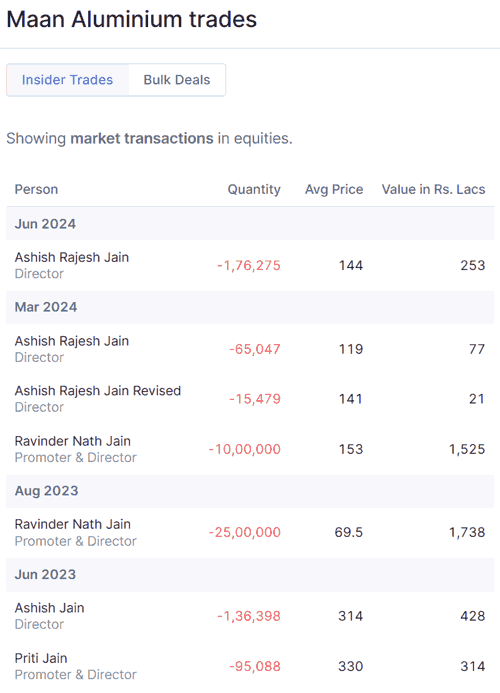
An investor would note that during June 2023, the share price of Maan Aluminium Ltd was about ₹330, which is not very high. However, still, during the year, the company did a share split (1:2) as well as a bonus share (1:1), so that each pre-split & bonus share of the company resulted in four shares in the hands of shareholders.
FY2024 annual report, page 113:
shareholders have passed resolution for sub-division/split of equity shares from 1 (one) equity share of face value of ₹ 10 each to 2 (two) equity shares of face value of ₹ 5 each and for further issue of bonus shares…in the ratio of 1:1
This combined action of share split and bonus share increased the liquidity of the company. At the same time, it produced enthusiasm in the retail investors, who see such actions positively.
An investor may form her own opinion whether, at the share price level of ₹300/-, the company needed the twin actions of share split and bonus shares, or it was an attempt to create liquidity so that promoters could sell their significantly large quantity of shares in the market without much “impact cost”.
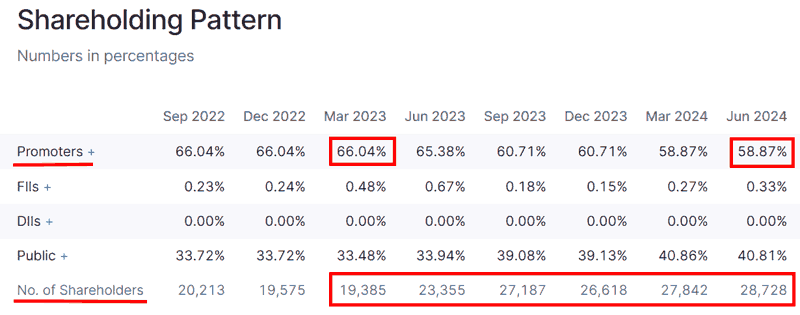
The shareholding data of Maan Aluminium Ltd from the Screener website below shows that during June 2023 and June 2024, when promoters sold about 7% stake in the company, the total number of shareholders, which primarily contains retail shareholders, increased from 19,385 in March 2023 to 28,728 in June 2024.
An investor may analyse these events to rule out the possibility that during the periods of share market euphoria, a company facilitates the sale of promoters’ stake to retail shareholders by increasing liquidity by way of share split and bonus shares.
Also read: How to know if Promoters are Losing Commitment to the Company
The Margin of Safety in the market price of Maan Aluminium Ltd:
Currently (October 10, 2025), Maan Aluminium Ltd is available at a price-to-earnings (PE) ratio of about 50.8 based on earnings of the last 12 months (July 2024-June 2025).
We recommend that an investor read the following articles to assess the P/E ratio to be paid for any stock, which considers the strength of the business model of the company as well. The strength in the business model of any company is measured by way of its self-sustainable growth rate and the free cash flow generating the ability of the company.
In the absence of any strength in the business model of the company, even a low PE ratio of the company’s stock may be a sign of a value trap where, instead of being a bargain, the low valuation of the stock price may represent the poor business dynamics of the company.
- 4 Principles to Decide the Ideal P/E Ratio of a Stock for Value Investors
- How to Earn High Returns at Low Risk – Invest in Low P/E Stocks
- Hidden Risk of Investing in High P/E Stocks
Analysis Summary
Overall, Maan Aluminium Ltd has increased its sales by 17% CAGR over the last 10 years. However, its growth has been uneven, marked by sharp declines such as a 40% fall between FY2020-2022 and a 15% decline from FY2024 to FY2025. Profitability has shown similar volatility, with operating margins swinging between 2% and 9% and net margins between 0.3% and 6% over the past decade.
These fluctuations reflect the cyclical nature of the aluminium industry and the company’s limited pricing power. Over the years, Maan Aluminium Ltd has suffered from an oversupply in the domestic market, competition from organised and unorganised players, and dumping from foreign manufacturers, all of which have affected its bargaining ability. As a result, it has struggled to pass on higher input costs to customers, leading to sharp contractions in margins during commodity price volatility.
To mitigate these issues, Maan Aluminium Ltd has pursued multiple strategies, like aligning aluminium purchases with customer orders, expanding its trading operations, adding value-added processes like anodising and powder-coating, and focusing on high-margin export sales.
The trading business increased its revenues sharply in earlier years; however, it had very low and unstable margins. Therefore, Maan Aluminium Ltd shifted its focus back to manufacturing and exports. However, still, demand volatility has still led to abrupt swings in its performance.
The company also faces significant regulatory risk; its exports, which now account for 40% of revenue, are heavily dependent on the US market. The recent doubling of US tariffs on aluminium imports poses a serious threat, as 85-90% of the company’s exports go to the US.
Operating efficiency indicators of Maan Aluminium Ltd present further concerns. Net fixed asset turnover has declined from 16.8 in FY2017 to 10.2 in FY2025, reflecting weaker asset utilisation as the focus shifted from trading to manufacturing. Inventory turnover has also fallen from 21.9 to 16.5 in the same period, raising concerns in a commodity business where holding high-cost inventory during price declines can lead to impairment losses.
Receivable collection has been another weak area, with consistent overdue trade receivables, some of which are stuck for over three years, leading to repeated write-offs of bad debts. While cumulative PAT over FY2016–2025 stood at ₹162 cr, cumulative cash flow from operations was only ₹82 cr, indicating poor cash conversion. With negative free cash flow over the past decade, it had to meet its cash shortfalls through additional debt.
Governance and management practices of Maan Aluminium Ltd raise a few red flags. The company has a promoter-led succession plan in place, but the involvement of multiple family members has chances of potential for ownership-related conflicts. Maan Aluminium Ltd has engaged in related-party transactions, including loans, purchases, rent, and payments to promoter family members, which require careful analysis by investors.
The company has done large expansions even when capacity utilisation was low, raising questions about timing and capital allocation. Maan Aluminium Ltd has reported interest income on overdue receivables, which has inflated net profits in some years despite the uncertainty of actual realisation.
Financial data submitted by the company to shareholders and to banks has shown discrepancies, which, at times, run into tens of crores. It indicates weaknesses in internal controls, which are further reinforced by errors and inconsistencies in annual reports.
The promoters of Maan Aluminium Ltd have also reduced their stake from 66% to 59% since 2023, selling shares worth over ₹40 cr while the company increased liquidity in the market through share splits and bonuses, raising questions about promoters’ commitment.
A combination of cyclical performance, low pricing power, poor cash conversion, reliance on external debt, related-party dealings, weak internal processes, and heavy dependence on US exports makes the business of Maan Aluminium Ltd exposed to multiple risks despite periods of strong revenue growth.
Going ahead, an investor should closely monitor whether Maan Aluminium Ltd can stabilise its profit margins and improve its cash flow generation. She should track the company’s ability to reduce overdue receivables, generate free cash flow without relying on additional debt, maintain efficient inventory and asset utilisation, and manage governance concerns around related-party transactions and promoter stake sales. In addition, the impact of US tariffs on its export-heavy model will be important in determining whether the company can sustain growth and build long-term competitive strength.
Further recommended reading: How to Monitor Stocks in your Portfolio
These are our views on Maan Aluminium Ltd. However, investors should do their own analysis before making any investment-related decisions about the company.
You may use the following steps to analyse the company: “Selecting Top Stocks to Buy – A Step by Step Process of Finding Multibagger Stocks”
I hope it helps!
Regards,
Dr Vijay Malik
P.S.
- Subscribe to Dr Vijay Malik’s Recommended Stocks: Click here
- Chennai “Peaceful Investing” Workshop | 26 July 2026: Register Here
- To learn stock investing through videos, you may subscribe to the Peaceful Investing – Workshop Videos
- 25% savings on buying our Stock Analysis Excel Template and all ebooks together: Analysis Package: Excel Template + All eBooks (25% savings)
- To download our customized Stock Analysis Excel Template for analysing companies: Stock Analysis Excel
- Learn about our stock analysis approach in the e-book: “Peaceful Investing – A Simple Guide to Hassle-free Stock Investing”
- To learn how to do business analysis of companies: e-book: Business Analysis Guide
- To pre-register/express interest in a “Peaceful Investing” workshop in your city: Click here
Disclaimer
I, Vijay Malik, am a SEBI-registered Research Analyst (Regn. No. INH100008364). This article is for educational purposes only and does not constitute investment advice or a recommendation to buy or sell any securities. Investors should do their own research before making any investment decisions.
I, or my immediate relatives, do not have any financial interest in the companies discussed as on the date of publication of this article, nor do we hold one per cent or more of the securities of such companies at the end of the month immediately preceding it. I do not have any material conflict of interest and have not received any compensation or other benefits from the companies or any third party in relation to this article during the 12 months preceding its publication. I have not served as an officer, director, or employee of the subject companies, nor have I been engaged in market making activity for them.


2 thoughts on “Analysis: Maan Aluminium Ltd”
Sir, another question. Sir, many times, we say that stocks fall (market cap deteriorates) due to many reasons. For example, overgrowth sentiment or business deterioration etc.
However, when the stock price falls and then some experienced people come and say that the public or retail made the stock fall too much below its deteriorated justified price. I have read this many times.
Can you tell how to price this, and can you give some examples of what you would do in this situation (some say that they bought at a lower price because the price problem was temporary or below its deserved value)? How to check that, sir?) And, Sir, can you give me some prior example, please ( I don’t want any stock advice recommendations).
Dear Shreeyansh,
In order to deal with such situations, an investor needs to form a stock analysis and investment process and stick to it as stock prices change.
The following article will help you in learning about our stock analysis process: Selecting Top Stocks to Buy – A Step-by-Step Process of Finding Multibagger Stocks
We request you to go through all the articles mentioned on the above page, and once you have read each of those articles, then write to us with your updated learning. We shall be happy to provide our inputs.
Regards,
Dr Vijay Malik